Machine Learning in Tableau with PyCaret
Machine Learning in Tableau with PyCaret
A step by step integration guide to setup ML pipelines within minutes
by Andrew Cowan-Nagora
PyCaret is a recently released open source machine learning library in Python that trains and deploys machine learning models in a **low-code **environment. To learn more about PyCaret, read this announcement.
This article will demonstrate how PyCaret can be integrated with Tableau Desktop and Tableau Prep which opens new avenues for analysts and data scientists to add a layer of machine learning to their dashboards, reports and visualizations. By reducing the time required to code as well as the need to purchase additional software, rapid prototyping is now possible in environments that are already familiar and available to analysts throughout the organization.
Learning Goals
Train a supervised machine learning model and create a ML pipeline in PyCaret
Load a trained ML pipeline into Tableau Desktop and Tableau Prep
Create a dashboard that communicates insights from the model
Understand how the model can be deployed into production with Tableau
Direct Marketing Business Context
The example here will focus on how to setup a basic direct marketing propensity model that uses a classification algorithm to predict which customers are most likely to initiate a visit after receiving an offer via text or email.
A dashboard will then be created that can take the trained model and predict how successful new campaigns are likely to be which is valuable for marketers who are designing promotional plans.
By using PyCaret and Tableau, the business can quickly setup reporting products that continuously generate predictive views using existing software and minimal up front development time.
Before we start
The software that will be required to follow along:
1 — Tableau Desktop
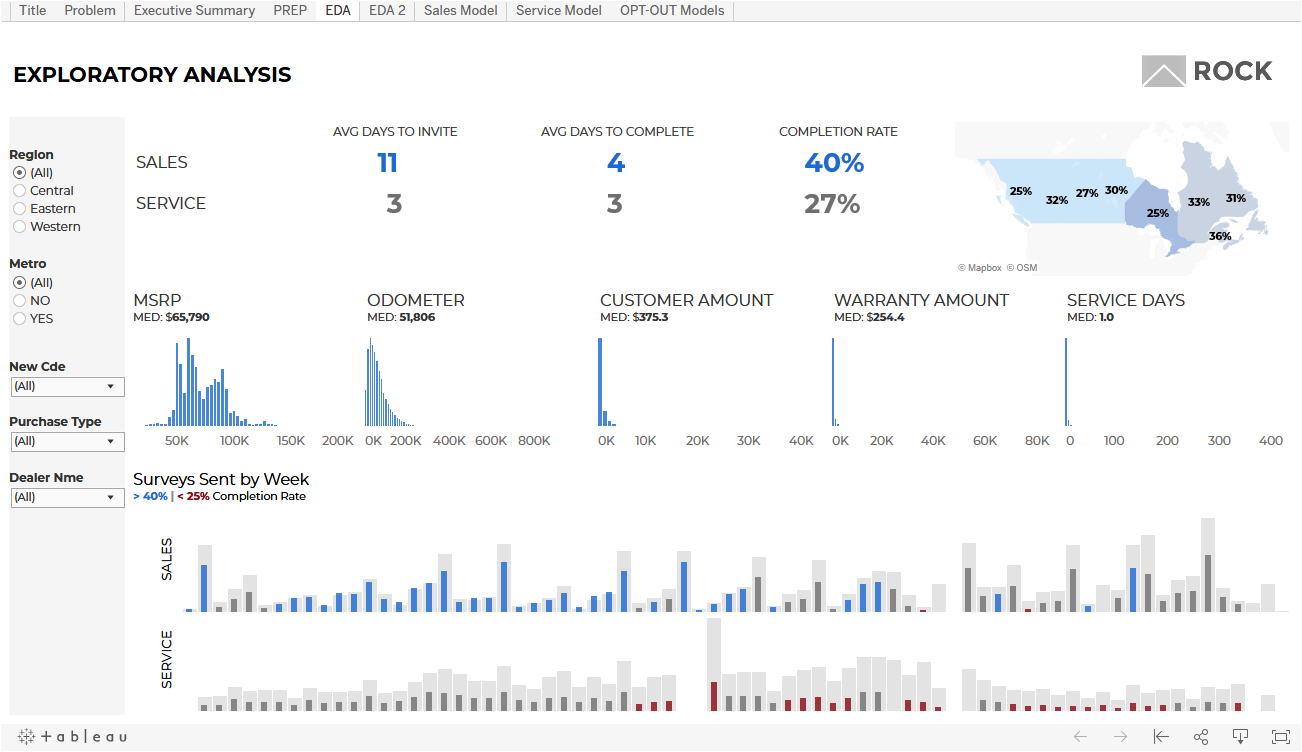
Tableau Desktop is a visual analytics tool that is used to connect to data, build interactive dashboards and share insights across the organization.
2 — Tableau Prep
Tableau Prep provides a visual interface to combine, clean and shape data by setting up flows and schedules.

3 — Python 3.7 or greater
Anaconda is a free, open-source distribution of the Python programming language for data science. If you haven’t used it before, you can download it here.

4 — PyCaret Python Library
To install the PyCaret library use the following code in Jupyter notebook or Anaconda prompt.
This may take up to 15 minutes. If any problems are encountered please see the project GitHub page for known issues.
5 — TabPy Python Library
TabPy is the Tableau supported library that is required run python scripts.
From the GitHub page:
TabPy (the Tableau Python Server) is an Analytics Extension implementation which expands Tableau’s capabilities by allowing users to execute Python scripts and saved functions via Tableau’s table calculations.
To install TabPy use the following code in Anaconda prompt or terminal.
Once installed use the following code to start up a local server using default settings.
To connect Tableau to the TabPy server go to Help > Settings and Performance > Manage Analytics Extension Connection. Select TabPy and enter localhost, port 9004 (default) and test connection.
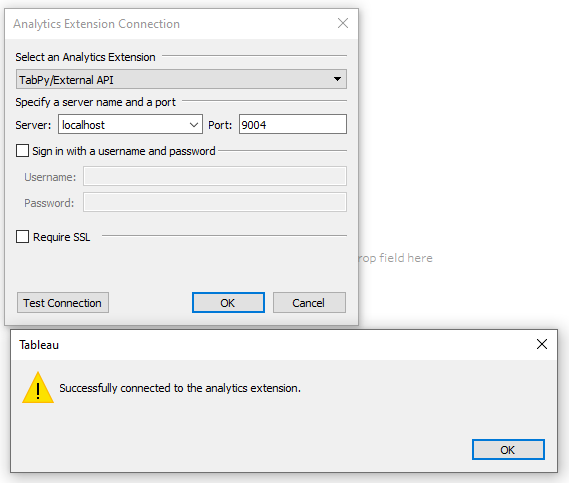
Python scripts can now be run in Tableau through calculated fields that output as table calculations.
Please refer to the TabPy GitHub page for custom server options. Running TabPy on external servers and/or clouds and configuring Tableau Server will not be covered in this post but please look here for more information.
Direct Marketing Data
The data set that will be used contains information on various marketing offers that were sent to customers through text and email. It contains 64000 records organized into an ID column, 10 features that relate to the customer or message sent and a binary target that indicates if a visit occurred. The data can be downloaded here.

Training a Model Beforehand
While it is possible to perform the model training process inside Tableau, this is generally not the preferred approach since every time the data is refreshed or the user interacts with the view the script will re-run. This is problematic because:
When the model is retrained with new data, the prediction may change unexpectedly.
Constantly re-running a script will impact the performance of the dashboard.
A more appropriate approach is to use a pre-trained model in Tableau to generate predictions on new data. Jupyter notebook will be used in this example to demonstrate how PyCaret is used to make this process straight forward.
Building a Model In PyCaret
Running the following code in Jupyter Notebook will train a Naive Bayes classification model and create a ML pipeline that is saved as a pickle file.
Notice that setting up and saving the model is accomplished in 4 lines of code. A complete notebook can be downloaded here.
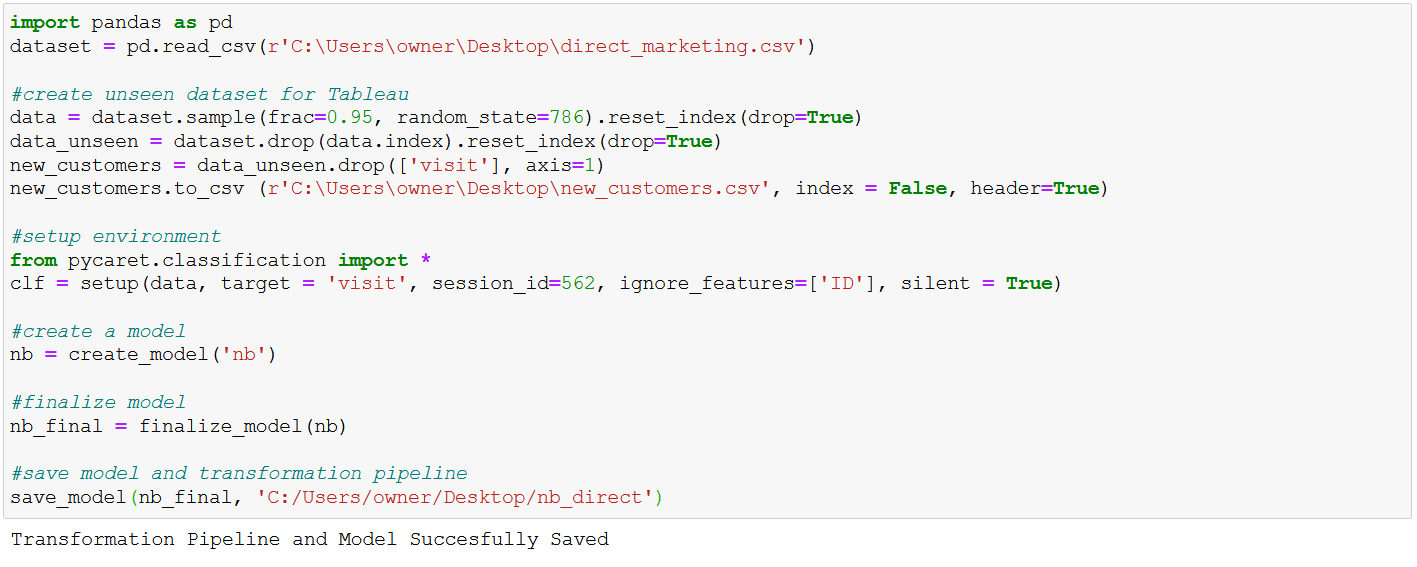

The unseen data will be used to simulate a list of new customers that have not yet been sent an offer. When the dashboard is deployed in production, it would be connected to a database containing the information for new customers.
Note that in the setup phase PyCaret performs automatic pre-processing which in this case expanded the number of features from 10 to 39 via one hot encoding.
This is only scratching the surface of PyCaret’s built in functionality thus it is strongly recommended to look at the classification module and tutorials on the PyCaret website. The specific details of the selected model will not be covered here.
Loading the Model into Tableau Desktop
The unseen data will now be passed to the trained model and labelled in Tableau Desktop.
Instructions:
Open Tableau and connect to the text file new_customer.csv that was created in the above code. This simply serves as an example but ideally the new or unlabelled customer data would reside in a database.
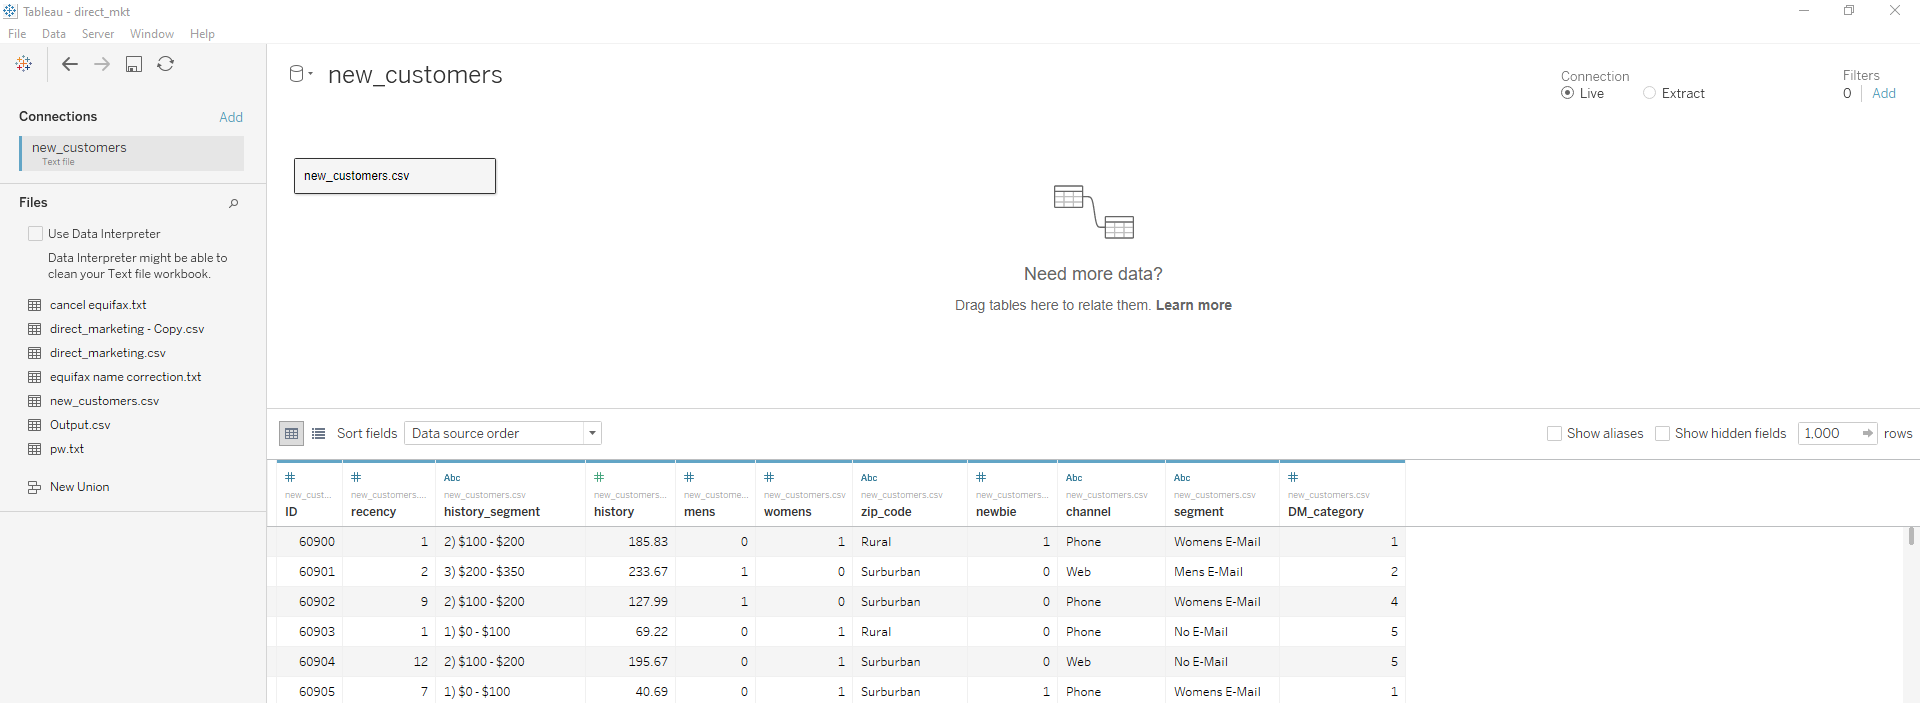
On a new sheet select analysis > create calculated field or simply right click in the data pane. Enter the following code:
SCRIPT_INT(" import pandas as pd import pycaret.classification
nb = pycaret.classification.load_model('C:/Users/owner/Desktop/nb_direct')
X_pred = pd.DataFrame({'recency':_arg1, 'history_segment':_arg2, 'history':_arg3, 'mens':_arg4, 'womens':_arg5,'zip_code':_arg6, 'newbie':_arg7, 'channel':_arg8, 'segment':_arg9, 'DM_category':_arg10})
pred = pycaret.classification.predict_model(nb, X_pred) return pred['Label'].tolist()
", SUM([recency]), ATTR([history_segment]), SUM([history]), SUM([mens]), SUM([womens]), ATTR([zip_code]), SUM([newbie]), ATTR([channel]), ATTR([segment]), SUM([DM_category]) )

The script function specifies the type of data that will be returned from the calculation. In this case it is the binary predicted label for visit.
The load_model() function from PyCaret loads the previously saved model and transformation pipeline that was saved as a pickle file.
X_pred is a dataframe that will map the data connected to Tableau as inputs through the _arg1, _arg2, _arg3… notation. The fields are listed at the end of the script.
predict_model() takes the trained model and predicts against the new data input. Note that the new data is passed through the transformation pipeline created in the PyCaret setup phase (encoding).
The labels are then returned as a list that can be viewed in Tableau.
By dragging the ID and Label columns into the view it is possible to see the model predictions.

It is important to understand that the output is a table calculation which has some limitations:
The script will only run when pulled into the view.
It cannot be used as a base for further calculations unless both are in the view.
The python generated data cannot be appended to Tableau extracts.
The script runs each time the view is changed which can lead to long wait times.
These drawbacks are quite significant as dashboard options become limited when each record must be contained in the view and the script takes around 4 minutes to run with 3200 records in this case.
Viable applications would include generating scored lists that could be exported or summary views such as the one below.

An example insight from this could be that higher spend customers are the most likely to visit which makes sense business wise but could perhaps be an indicator of unnecessary discounting.
Loading the Model into Tableau Prep
A great alternative to get around the limitations of running scripts directly in Tableau Desktop is to use Tableau Prep. New data can be connected and then passed to the model with the difference this time being that the predicted labels are appended to the output. When connected to Tableau, the new columns can be used normally rather than as table calculations.
Instructions:
Open Tableau Prep and connect to the text file new_customer.csv that was created in the above code.

Select the ‘+’ button next to the file in the flow pane and add the script option. Like in Tableau Desktop, connect to the TabPy server that should still be running in the background using localhost and 9004.
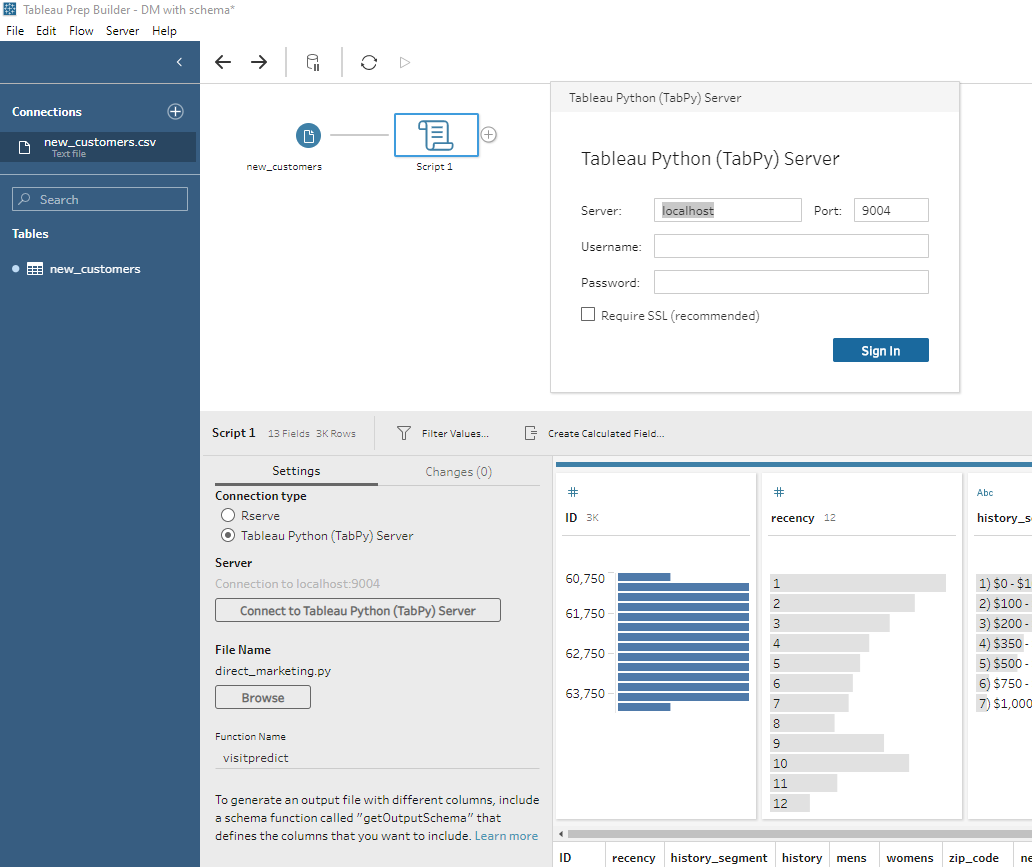
Next, the following python script will need to be created and connected to prep using the browse option. It can be downloaded here.

A function is created that loads the pickle file which holds the saved model and transformation pipeline. The data loaded into prep is automatically held in the df object and is passed to the model.
The PyCaret output will return the initial data set and two new appended columns; Label (prediction) and Score (probability of prediction). The output schema ensures that the columns and data types are correctly read into prep.
The function name must then be entered into prep.

Select the ‘+’ sign next to the script icon and choose output. It is possible to publish as a .tde or .hyper file to Tableau Server which would be the preferred method in a production environment but for this example a .csv file will be sent to the desktop.

Notice how the label and score columns are now appended to the original data set. Select ‘run flow’ to generate the output. The flow file can be downloaded here.
In a server environment it is possible to schedule when a flow runs and automate the scoring process before the data reaches the actual Tableau dashboard.
Loading the Flow Output into Tableau
The newly labelled data can now be connected to Tableau Desktop without the table calculation limitations and slow downs.
Aggregations and any other desired calculations can be created to design a summary dashboard that displays various predictive metrics:

Once the data and ML pipeline is established, marketers and executives would quickly be able to track how upcoming campaigns could potentially perform with minimal intervention required. The Tableau file that contains the example dashboard and earlier script can be downloaded here.
Closing Remarks
This article has demonstrated how PyCaret can be integrated with Tableau Desktop and Tableau Prep to quickly add a layer of machine learning into existing workflows.
By using tools that are familiar to the organization and the PyCaret library, entire ML pipelines can be established in minutes which enables predictive analytics prototyping to get off the ground quickly.
Useful Links
Last updated
Was this helpful?