> For the complete documentation index, see [llms.txt](https://pycaret.gitbook.io/docs/llms.txt). Markdown versions of documentation pages are available by appending `.md` to page URLs; this page is available as [Markdown](https://pycaret.gitbook.io/docs/learn-pycaret/official-blog/anomaly-detector-in-power-bi-using-pycaret.md).
# Anomaly Detector in Power BI using PyCaret
### Build your first Anomaly Detector in Power BI using PyCaret
#### A step-by-step tutorial for implementing anomaly detection in Power BI
#### by Moez Ali
In our last post, [Machine Learning in Power BI using PyCaret](https://towardsdatascience.com/machine-learning-in-power-bi-using-pycaret-34307f09394a), we presented a **step-by-step tutorial** on how PyCaret can be integrated within Power BI, thus allowing analysts and data scientists to add a layer of machine learning to their Dashboards and Reports without any additional license costs.
In this post, we will dive deeper and implement an Anomaly Detector in Power BI using PyCaret. If you haven’t heard about PyCaret before, please read this [announcement](https://towardsdatascience.com/announcing-pycaret-an-open-source-low-code-machine-learning-library-in-python-4a1f1aad8d46) to learn more.
### Learning Goals of this Tutorial
* What is Anomaly Detection? Types of Anomaly Detection?
* Train and implement an unsupervised anomaly detector in Power BI.
* Analyze results and visualize information in a dashboard.
* How to deploy the anomaly detector in Power BI production?
### Before we start
If you have used Python before, it is likely that you already have Anaconda Distribution installed on your computer. If not, [click here](https://www.anaconda.com/distribution/) to download Anaconda Distribution with Python 3.7 or greater.

### Setting up the Environment
Before we start using PyCaret’s machine learning capabilities in Power BI we have to create a virtual environment and install pycaret. It’s a three-step process:
[✅](https://fsymbols.com/signs/tick/) **Step 1 — Create an anaconda environment**
Open \*\*Anaconda Prompt \*\*from start menu and execute the following code:
```
conda create --name **myenv** python=3.7
```
[✅](https://fsymbols.com/signs/tick/) **Step 2 — Install PyCaret**
Execute the following code in Anaconda Prompt:
```
pip install pycaret
```
Installation may take 15–20 minutes. If you are having issues with installation, please see our [GitHub](https://www.github.com/pycaret/pycaret) page for known issues and resolutions.
[✅](https://fsymbols.com/signs/tick/)**Step 3 — Set Python Directory in Power BI**
The virtual environment created must be linked with Power BI. This can be done using Global Settings in Power BI Desktop (File → Options → Global → Python scripting). Anaconda Environment by default is installed under:
C:\Users\***username**\*\AppData\Local\Continuum\anaconda3\envs\myenv

### What is Anomaly Detection?
Anomaly Detection \*\*\*\*is a technique in machine learning used for identifying **rare items**, **events** or **observations** which raise suspicions by differing significantly from the majority of the data.
Typically, the anomalous items will translate to some kind of problem such as bank fraud, a structural defect, medical problems or error. There are three ways to implement an anomaly detector:
\*\*(a) Supervised: \*\*Used when the data set has labels identifying which transactions are anomaly and which are normal. *(this is similar to a supervised classification problem)*.
\*\*(b) Semi-Supervised: \*\*The idea behind semi-supervised anomaly detection is to train a model on normal data only *(without any anomalies)*. When the trained model is then used on unseen data points, it can predict whether the new data point is normal or not (based on the distribution of the data in the trained model).
\*\*(c) Unsupervised: \*\*Exactly as it sounds, unsupervised means no labels and therefore no training and test data set. In unsupervised learning a model is trained on the complete dataset and assumes that the majority of the instances are normal. While looking for instances that seem to fit least to the remainder. There are several unsupervised anomaly detection algorithms such as Isolation Forest or One-Class Support Vector Machine. Each has their own method of identifying anomalies in the dataset.
This tutorial is about implementing unsupervised anomaly detection in Power BI using a Python library called PyCaret. Discussion of the specific details and mathematics behind these algorithms are out-of-scope for this tutorial.

### Setting the Business Context
Many companies issue corporate credit cards (*also known as purchase cards or* *p-cards*) to employees for effectively managing operational purchasing. Normally there is a process in place for employees to submit those claims electronically. The data collected is typically transactional and likely to include date of transaction, vendor name, type of expense, merchant and amount.
In this tutorial we will use State Employees Credit Card Transactions from 2014–2019 for the Department of Education in the State of Delaware, US. The data is available online on their [open data](https://data.delaware.gov/Government-and-Finance/Credit-Card-Spend-by-Merchant/8pzf-ge27) platform.

**Disclaimer:** *This tutorial demonstrates the use of PyCaret in Power BI to build an anomaly detector. The sample dashboard that is built in this tutorial by no means reflects actual anomalies or is meant to identify anomalies.*
### 👉 Let’s get started
Now that you have setup the Anaconda Environment, installed PyCaret, understand the basics of Anomaly Detection and have the business context for this tutorial, let’s get started.
### 1. Get Data
The first step is importing the dataset into Power BI Desktop. You can load the data using a web connector. (Power BI Desktop → Get Data → From Web).
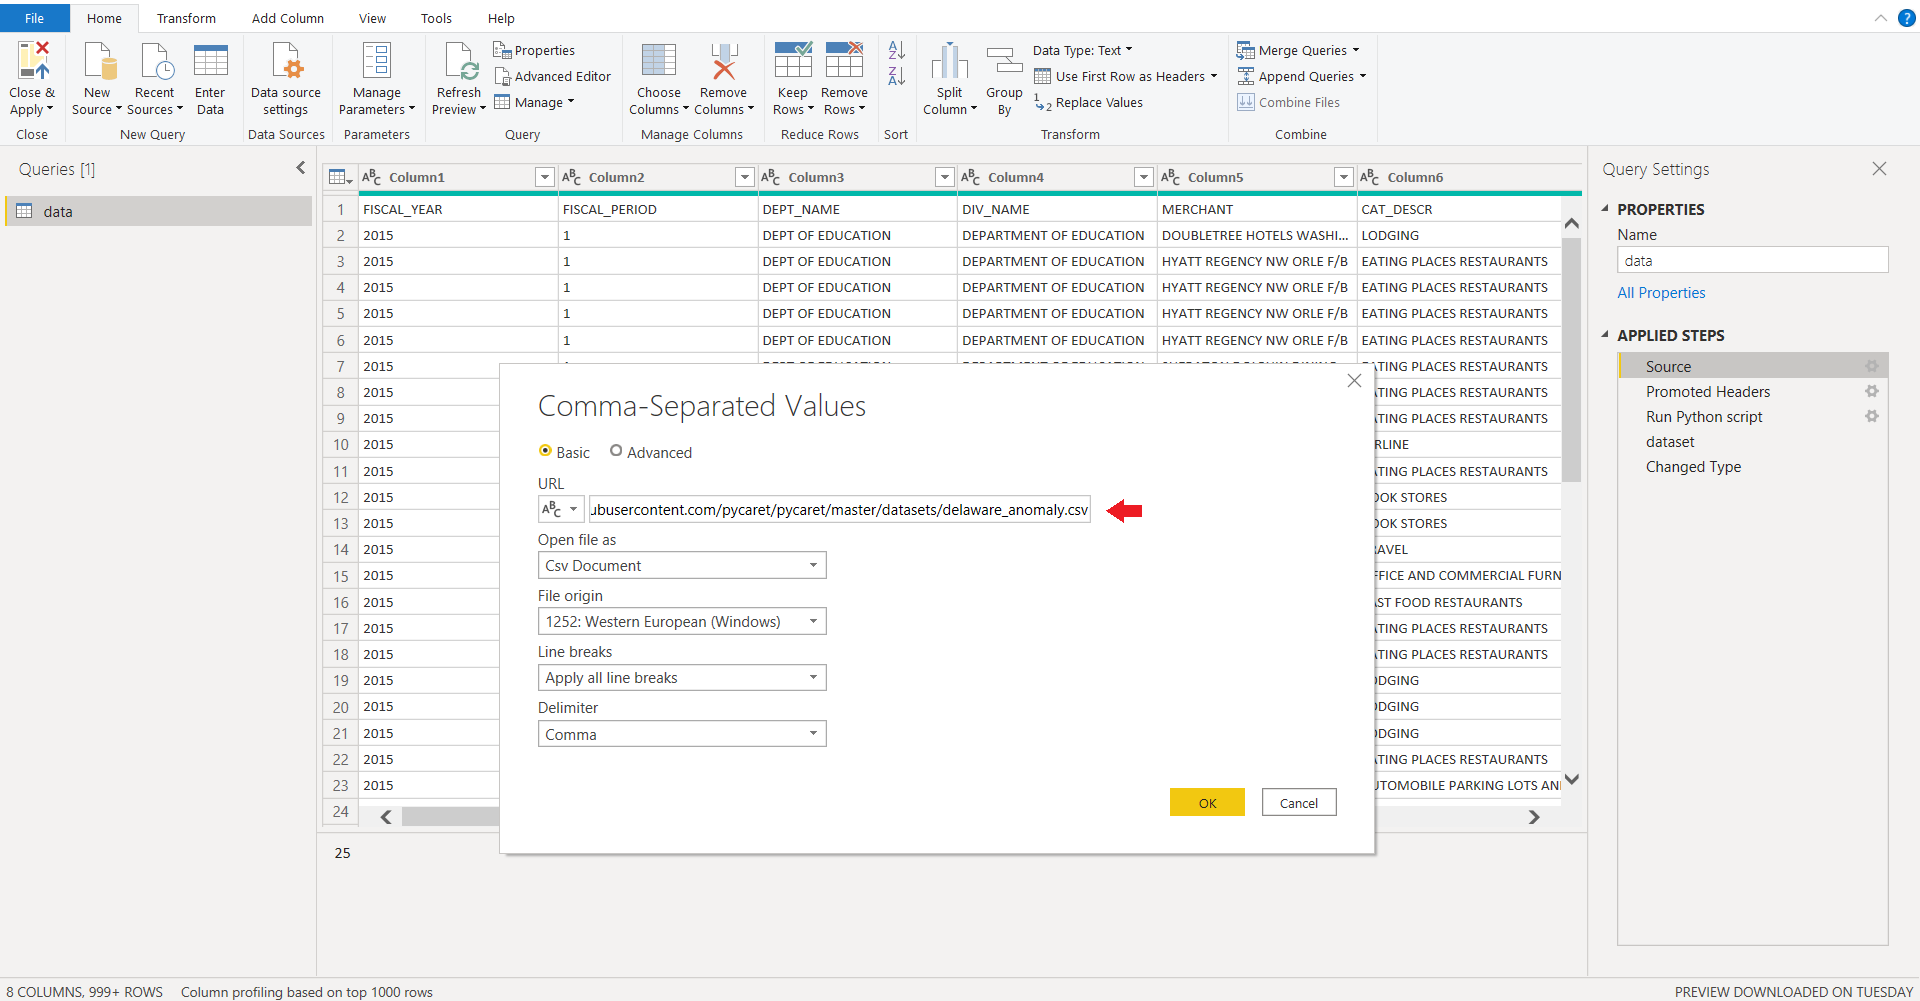
\*\*Link to csv file: [\*\*https://raw.githubusercontent.com/pycaret/pycaret/master/datasets/delaware\_anomaly.csv](https://raw.githubusercontent.com/pycaret/pycaret/master/datasets/delaware_anomaly.csv)
### 2. Model Training
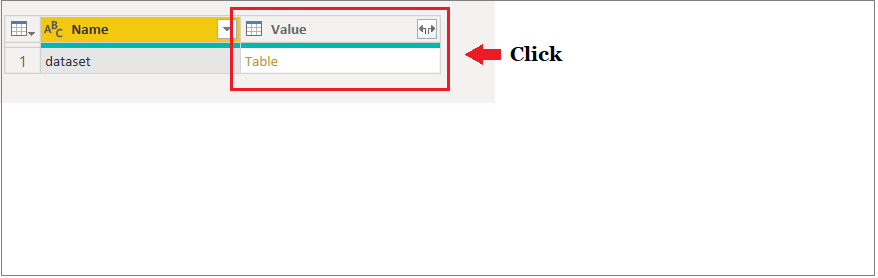
To train an anomaly detector in Power BI we will have to execute a Python script in Power Query Editor (Power Query Editor → Transform → Run python script). Run the following code as a Python script:
```
from **pycaret.anomaly** import *
dataset = **get_outliers**(dataset, ignore_features=['DEPT_NAME', 'MERCHANT', 'TRANS_DT'])
```

We have ignored a few columns in the dataset by passing them under **ignore\_features** parameter. There could be many reasons for which you might not want to use certain columns for training a machine learning algorithm.
PyCaret allows you to hide instead of drop unneeded columns from a dataset as you might require those columns for later analysis. For example, in this case we don't want to use transactional date for training an algorithm and hence we have passed it under **ignore\_features.**
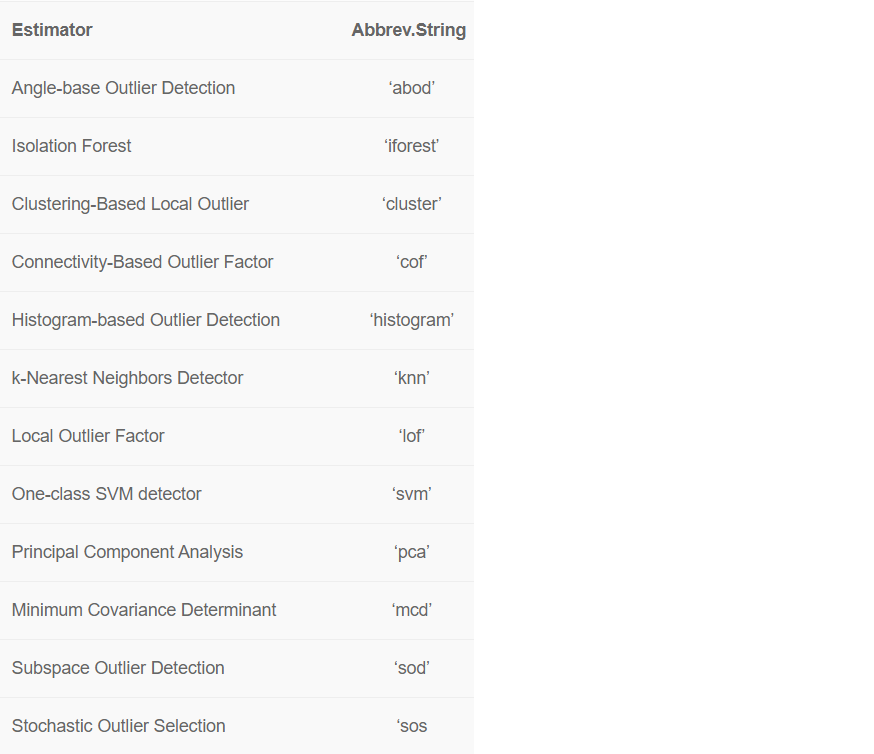
There are over 10 ready-to-use anomaly detection algorithms in PyCaret.
By default, PyCaret trains a **K-Nearest Neighbors Anomaly Detector** with 5% fraction (i.e. 5% of the total number of rows in the table will be flagged as outliers). Default values can be changed easily:
* To change the fraction value you can use the \*\*\*fraction \*\*\*parameter within the \*\*get\_outliers( ) \*\*function.
* To change the model type use the \*\*\*model \*\*\*parameter within **get\_outliers()**.
See an example code for training an **Isolation Forest** detector with 0.1 fraction:
```
from **pycaret.anomaly** import *
dataset = **get_outliers**(dataset, model = 'iforest', fraction = 0.1, ignore_features=['DEPT_NAME', 'MERCHANT', 'TRANS_DT'])
```
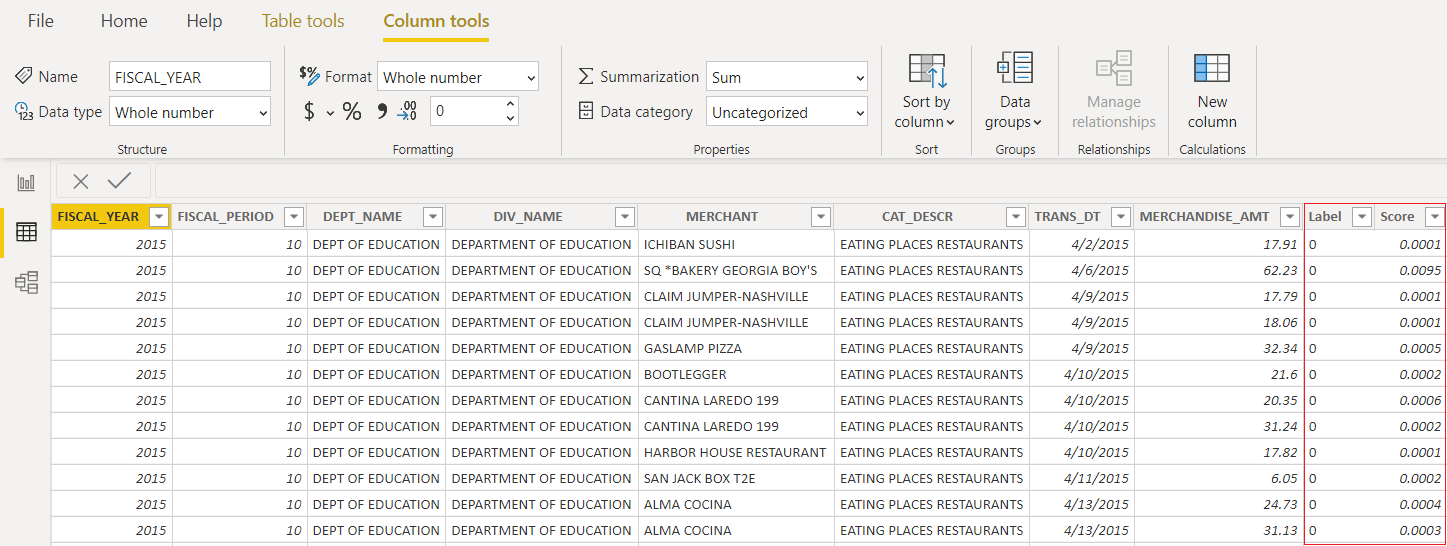
**Output:**
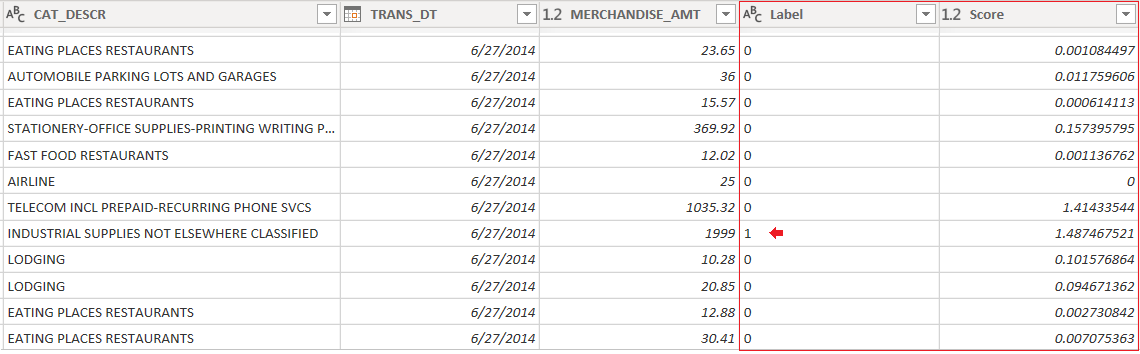
Two new columns are attached to the original table. Label (1 = outlier, 0 = inlier) and Score (data points with high scores are categorized as outlier). Apply the query to see results in Power BI data set.
### 3. Dashboard
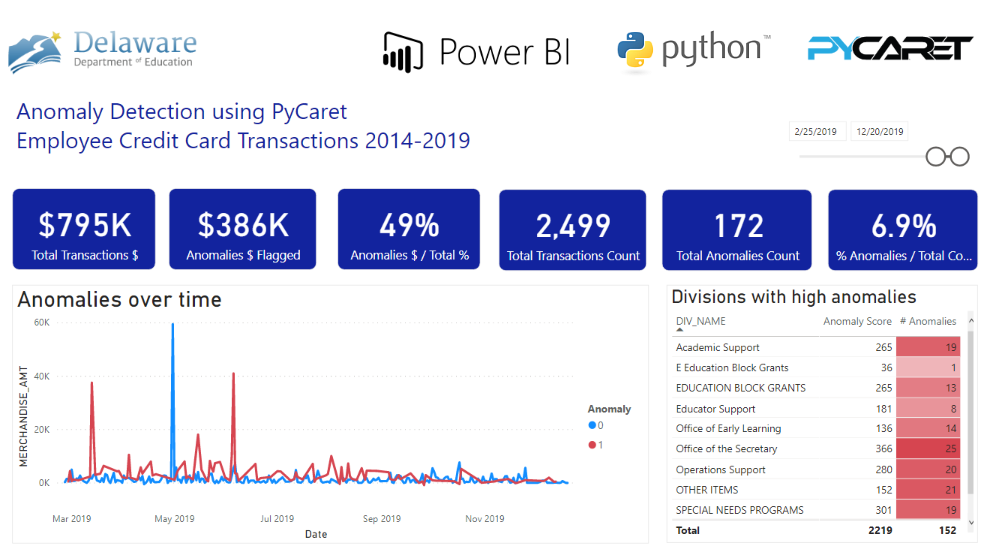
Once you have Outlier labels in Power BI, here’s an example of how you can visualize it in dashboard:
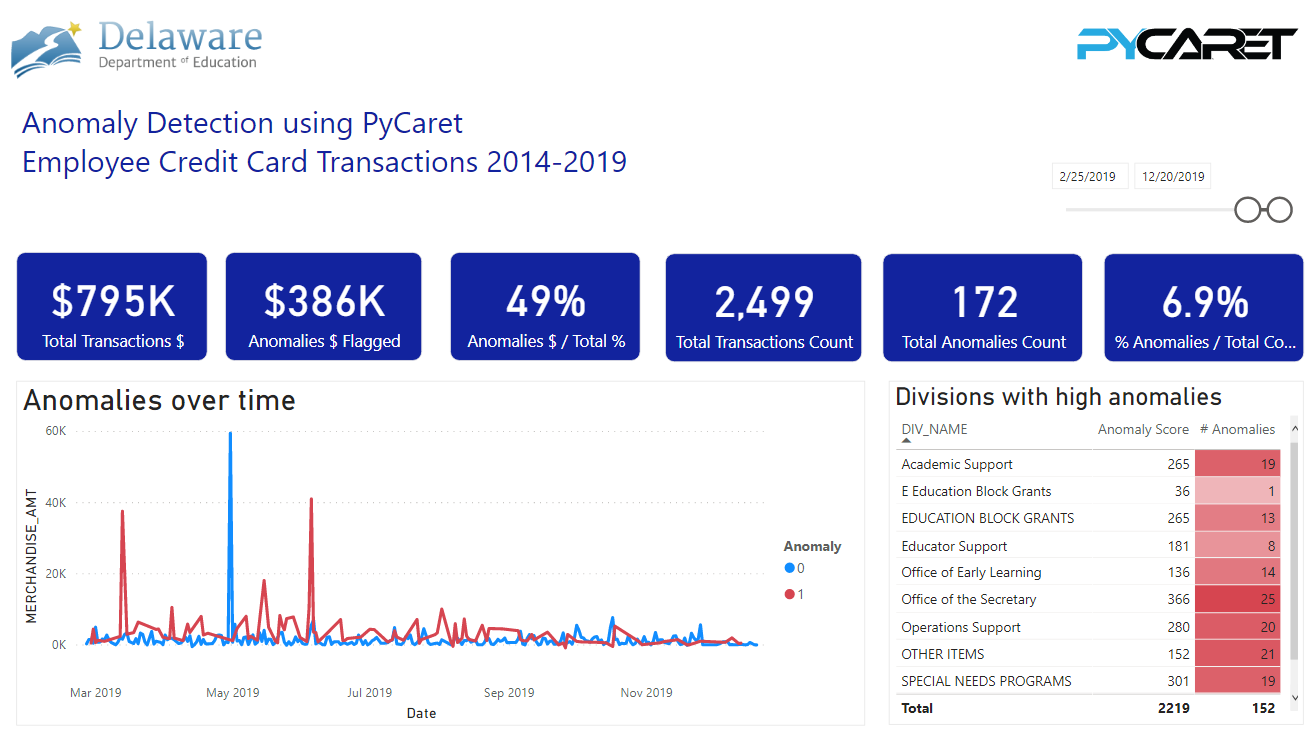

You can download the PBIX file and the data set from our [GitHub](https://github.com/pycaret/powerbi-anomaly-detection).
### 👉 Implementing Anomaly Detection in Production
What has been demonstrated above was one simple way to implement Anomaly Detection in Power BI. However, it is important to note that the method shown above train the anomaly detector every time the Power BI dataset is refreshed. This may be a problem for two reasons:
* When the model is re-trained with new data, the anomaly labels may change (some transactions that were labeled as outliers earlier may not be considered outliers anymore)
* You don’t want to spend hours of time everyday re-training the model.
An alternative way to implement anomaly detection in Power BI when it is intended to be used in production is to pass the pre-trained model to Power BI for labeling instead of training the model in Power BI itself.
### **Training Model before-hand**
You can use any Integrated Development Environment (IDE)or Notebook for training machine learning models. In this example, we have used Visual Studio Code to train an anomaly detection model.
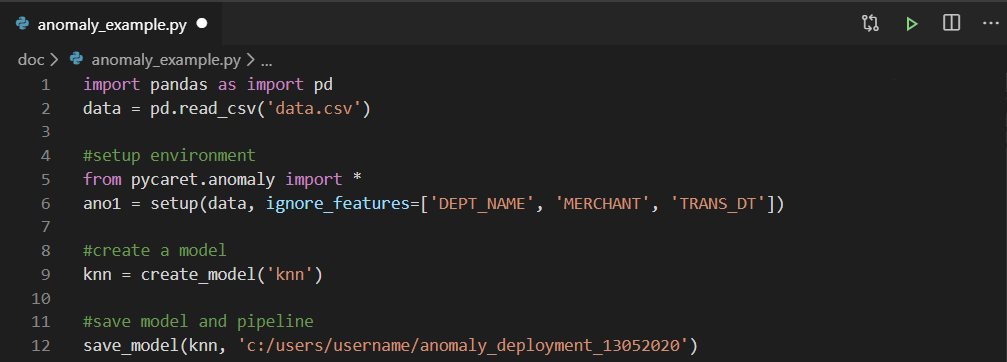
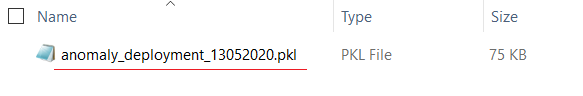
A trained model is then saved as a pickle file and imported into Power Query for generating anomaly labels (1 or 0).
If you would like to learn more about implementing Anomaly Detection in Jupyter notebook using PyCaret, watch this 2 minute video tutorial:
### Using the pre-trained model
Execute the below code as a Python script to generate labels from the pre-trained model.
```
from **pycaret.anomaly** import *
dataset = **predict_model**('c:/.../anomaly_deployment_13052020, data = dataset)
```
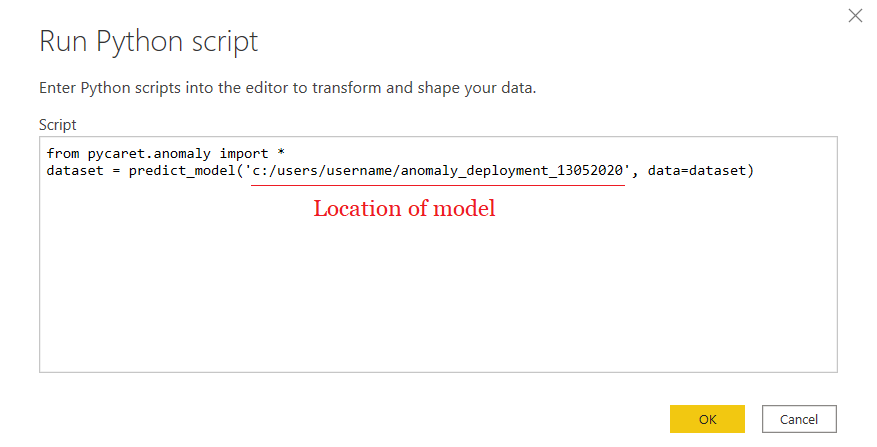
The output of this will be the same as the one we saw above. However, the difference is that when you use a pre-trained model, the label is generated on a new dataset using the same model instead of re-training the model every time you refresh the Power BI dataset.

### **Making it work on Power BI Service**
Once you’ve uploaded the .pbix file to the Power BI service, a couple more steps are necessary to enable seamless integration of the machine learning pipeline into your data pipeline. These include:
* **Enable scheduled refresh for the dataset** — to enable a scheduled refresh for the workbook that contains your dataset with Python scripts, see [Configuring scheduled refresh](https://docs.microsoft.com/en-us/power-bi/connect-data/refresh-scheduled-refresh), which also includes information about **Personal Gateway**.
* **Install the Personal Gateway** — you need a **Personal Gateway** installed on the machine where the file is located, and where Python is installed; the Power BI service must have access to that Python environment. You can get more information on how to [install and configure Personal Gateway](https://docs.microsoft.com/en-us/power-bi/connect-data/service-gateway-personal-mode).
If you are Interested in learning more about Anomaly Detection, checkout our [Notebook Tutorial.](https://pycaret.org/ano101/)
### PyCaret 1.0.1 is coming!
We have received overwhelming support and feedback from the community. We are actively working on improving PyCaret and preparing for our next release. **PyCaret 1.0.1 will be bigger and better**. If you would like to share your feedback and help us improve further, you may [fill this form](https://www.pycaret.org/feedback) on the website or leave a comment on our [GitHub ](https://www.github.com/pycaret/)or [LinkedIn](https://www.linkedin.com/company/pycaret/) page.
Follow our [LinkedIn](https://www.linkedin.com/company/pycaret/) and subscribe to our [Youtube](https://www.youtube.com/channel/UCxA1YTYJ9BEeo50lxyI_B3g) channel to learn more about PyCaret.
### Important Links
[User Guide / Documentation](https://www.pycaret.org/guide) [GitHub Repository ](https://www.github.com/pycaret/pycaret)[Install PyCaret](https://www.pycaret.org/install) [Notebook Tutorials](https://www.pycaret.org/tutorial) [Contribute in PyCaret](https://www.pycaret.org/contribute)
### Want to learn about a specific module?
As of the first release 1.0.0, PyCaret has the following modules available for use. Click on the links below to see the documentation and working examples in Python.
[Classification](https://www.pycaret.org/classification) [Regression ](https://www.pycaret.org/regression)[Clustering](https://www.pycaret.org/clustering) [Anomaly Detection ](https://www.pycaret.org/anomaly-detection)[Natural Language Processing](https://www.pycaret.org/nlp) [Association Rule Mining](https://www.pycaret.org/association-rules)
### Also see:
PyCaret getting started tutorials in Notebook:
[Clustering](https://www.pycaret.org/clu101) [Anomaly Detection](https://www.pycaret.org/anom101) [Natural Language Processing](https://www.pycaret.org/nlp101) [Association Rule Mining](https://www.pycaret.org/arul101) [Regression](https://www.pycaret.org/reg101) [Classification](https://www.pycaret.org/clf101)
### Would you like to contribute?
PyCaret is an open source project. Everybody is welcome to contribute. If you would like contribute, please feel free to work on [open issues](https://github.com/pycaret/pycaret/issues). Pull requests are accepted with unit tests on dev-1.0.1 branch.
Please give us ⭐️ on our [GitHub repo](https://www.github.com/pycaret/pycaret) if you like PyCaret.
Medium : [https://medium.com/@moez\_62905/](https://medium.com/@moez_62905/machine-learning-in-power-bi-using-pycaret-34307f09394a)
LinkedIn :
Twitter :
---
# Agent Instructions
This documentation is published with GitBook. GitBook is the documentation platform designed so that both humans and AI agents can read, navigate, and reason over technical content effectively. Learn more at gitbook.com.
## Querying This Documentation
If you need additional information that is not directly available in this page, you can query the documentation dynamically by asking a question.
Perform an HTTP GET request on the current page URL with the `ask` query parameter, and the optional `goal` query parameter:
```
GET https://pycaret.gitbook.io/docs/learn-pycaret/official-blog/anomaly-detector-in-power-bi-using-pycaret.md?ask=&goal=
```
`ask` is the immediate question: it should be specific, self-contained, and written in natural language.
`goal` is optional and describes the broader end goal you are ultimately trying to accomplish on behalf of the user. GitBook uses it to tailor the answer towards what is most useful for that goal.
The response will contain a direct answer to the question and relevant excerpts and sources from the documentation.
Use this mechanism when the answer is not explicitly present in the current page, you need clarification or additional context, or you want to retrieve related documentation sections.