Predicting Crashes in Gold Prices Using PyCaret
Predicting Crashes in Gold Prices Using Machine Learning
by Mohammad Riazuddin
Part — III of Gold Prediction Series. Step by step guide to predict a crash in Gold prices using Classification with PyCaret
Approach
In the previous two parts of the Gold Prediction series, we discussed how to import data from free yahoofinancials API and build a regression model to predict return from Gold over two horizons. i.e 14-Day and 22-Day.
In this part, we will try to predict if there would be a ‘sharp fall’ or ‘crash’ in Gold Prices over next 22-Day period. We would be using a classification technique for this experiment. We will also learn how to use the trained model to make a prediction on new data every day. The steps for this exercise would be:
**Import and shape the data **— This would be similar to what was explained in Part-I here. You can also download the final dataset from my git repo.
Define ‘sharp fall’ in Gold Prices. Sharp is not an absolute measure. We will try to define ‘sharp fall’ objectively
**Create Label **— Based on the definition of ‘sharp fall’, we would create labels on historical data
Train models to predict the *‘sharp fall’ *and use trained model to make prediction on new data
Preparing Data
This part is exactly the same as we did in Part I. The notebook contains the entire code chunk for data import and manipulation or you can directly start by loading the dataset which can be downloaded from the link here.
Defining ‘Sharp Fall’
Any classification problem needs labels. Here we need to create labels by defining and quantifying ‘sharp fall’.
To define ‘sharp’, I am defining a threshold such that the probability of returns being lower than the threshold for any window (22 Days here and 14 Days here) is 15% (basically left tail of normal distribution with p=0.15). For this, I will need to assume that the distribution of returns is normal. Looking at the distribution of returns, this is a very reasonable assumption to make.
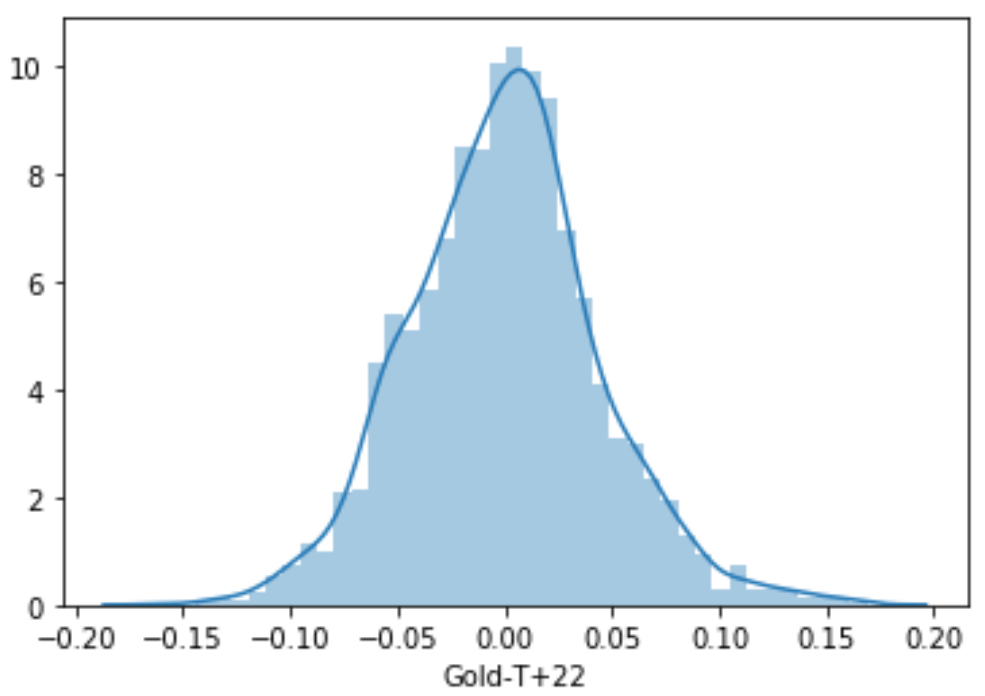
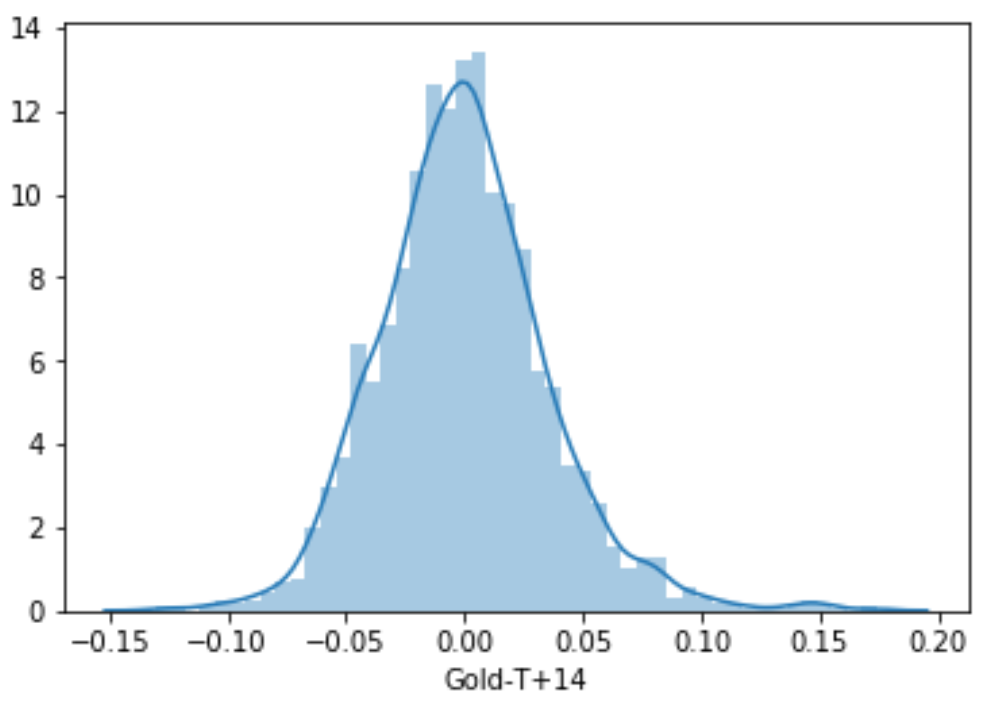
To get to the threshold return level for both the windows (14-Day and 22-Day), I would first define the p-value of the left tail of the distribution, which would be 15% in this case. Using this p-value, we get the z-value of the -1.0364 from a standard normal distribution. The following code would do it for us.
Now, based on the above z-value and Mean and SD of returns for each window, we will get threshold return levels. The forward returns for 14 Day and 22 Day period are in columns “Gold-T+14” and “Gold-T+22” in the ‘data’.
So the threshold return levels are -0.0373 or -3.73% for 14-Day window and -0.0463 or -4.63% for 22-Day window. What this implies is, there is only 15% probability of 14-Day returns being lower than -3.73% and 22-Day return being lower than -4.63%. This is a concept similar to what is used in the calculation of Value At Risk (VAR).
Creating Labels
We will use the above threshold levels to create labels. Any returns in the two windows lower than the respective threshold will be labeled as 1, else as 0.
Out of total 2,379 instances, there have been 338 instances where 14-Day returns have been lower than the threshold of -3.73% and 356 instances for 22-Day when returns have been lower than threshold of -4.63%.
Once we have these labels, we do not actually need the returns columns and hence we delete the actual returns columns.
Modelling with PyCaret
22-Day Window
We will start with the 22-Day window here. I will be using PyCaret’s Classification module here for experimentation.
We import the module above form PyCaret and then delete the label for 14-Day since we are working with 22-Day window here. Just like in Regression, to begin the classification exercise, we need to run setup() command to point out the data and target column. Remember all the basic pre-processing is taken care of by PyCaret in the background.
To evaluate the set of all the models, we will run the *compare_models() *command with turbo set to False because I want to evaluate all the models currently available in the library.

Before proceeding with the selection of models, we need to understand which metric is most valuable to us. Choosing a metric in a classification experiment depends on the business problem. There is always a trade-off between Precision and Recall. This means we have to choose and favor a balance between True Positives and False Negatives.
Here, the final model will be used to create a flag for the investor/analyst warning him about the possibility of an impending crash. The investor will then make the decision to hedge his position against the possible fall. Therefore, it is very important that the model is able the predict all/most of the drastic falls. In other words, we want to choose a model with a better ability to have True Positives (better Recall), even if it comes with the cost of some False Positives (lower Precision). In other words, we do not want the model to miss the possibility of *‘sharp fall’. *We can afford to have some False Positive because if the model predicts that there will be a sharp fall, and the investor hedges his position, but the fall does not occur, the investor will lose opportunity cost of remaining invested or at most hedge cost (say if he buys out of money Put Options). This cost will be lower than the cost of false negative where the model predicts no ‘Sharp Fall’, but a massive fall does happen. We need to however keep a tab on the trade-offs in **Precision **and AUC.
We will go ahead and create four models namely MLP Classifier (mlp), Extra-Tree Classifier (et), Cat Boost Classifier (catb) and Light Gradient Boosting Machine (lgbm) with best **Recall **and reasonable AUC/Precision.
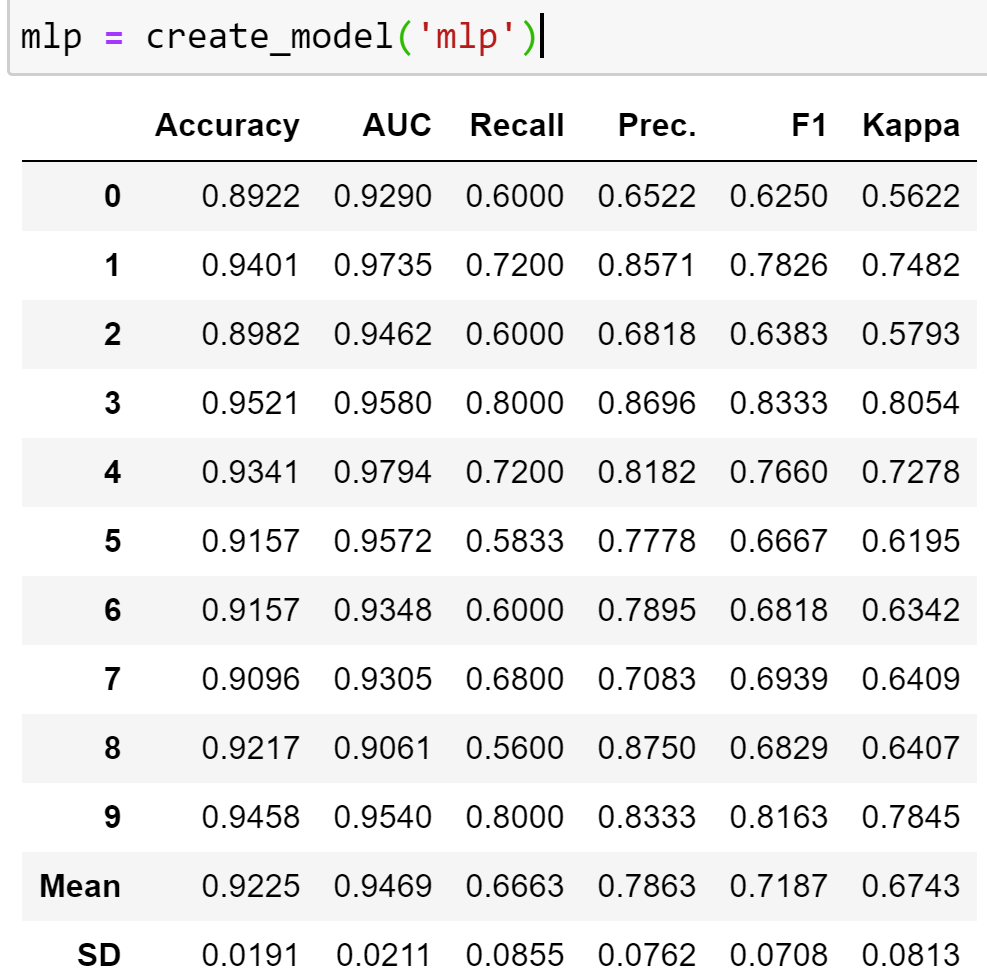
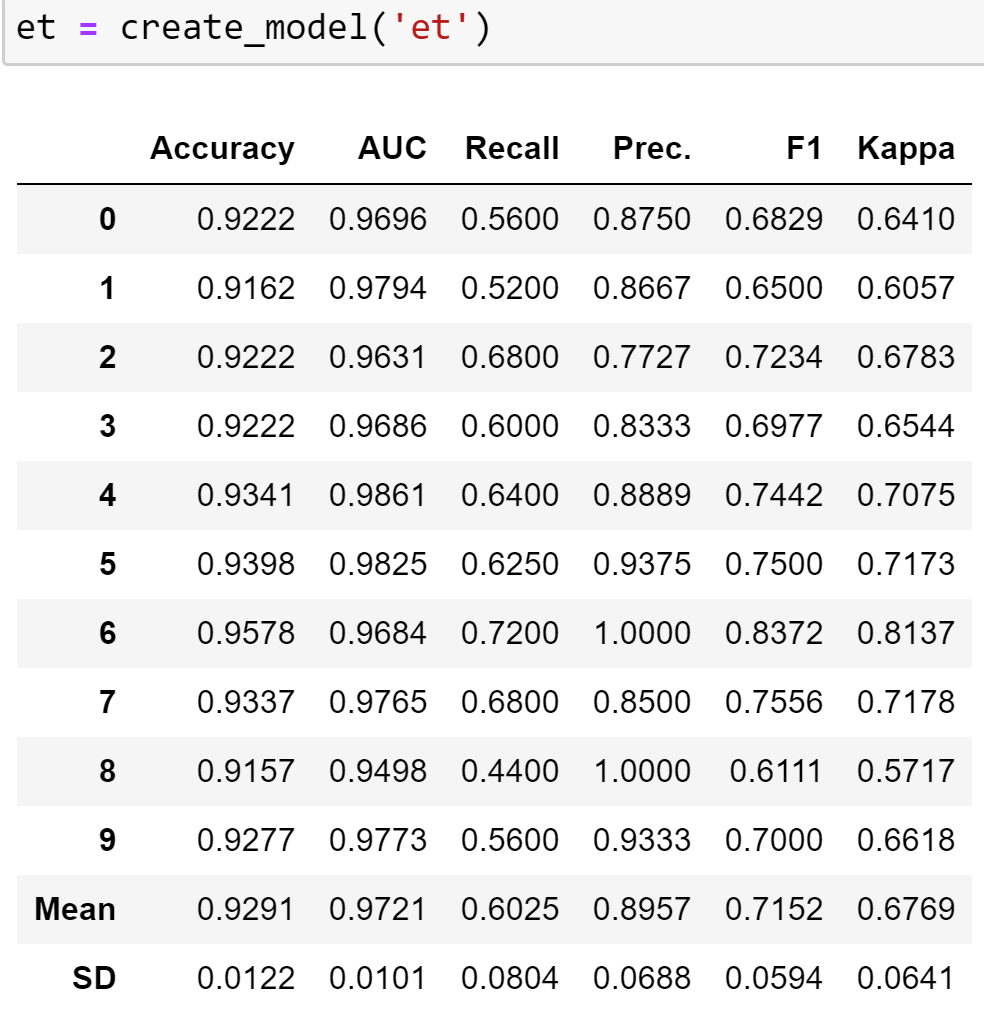


Based on the results we have, MLP Classifier appears to be the best choice with the highest recall and very decent AUC of 94.7%.
Hyper-Parameter Tuning
Once we have the top four models which we would want to pursue further, we need to find the best hyperparameters for the models. PyCaret has a very convenient function of ***tune_model() ***which loops through pre-defined hyper-parameter grids to find the best parameters for our model through 10 fold cross-validation. PyCaret uses the standard Randomized-Grid search to iterate through the parameters. The number of iterations (n_iter) can be specified to a high number based on compute capacity and time constrain. Within the tune_function(), PyCaret also allows us to specify the metric we want to optimize. The default is Accuracy, but we can choose other metrics as well. Like we would choose Recall here since it is the metric we would want to increase/optimize.

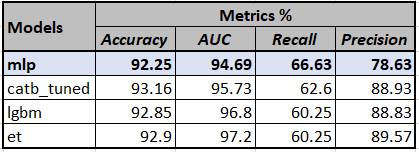
The code above tunes the Cat-Boost classifier to optimize **‘Recall’ **by iterating 50 times over the defined grid and displays the 6 metrics for each fold. We see that Mean Recall has improved from 58.2% in base Cat-Boost to 62.6% here. This is a massive jump, not so common at the tuning stage. However, it still remains lower than 66.6% of base ‘mlp’ that we created earlier. For the other three models, we did not see improvement in performance by tuning (example in the notebook). The reason being the random nature of iterating through the parameters. There however would exist a parameter that would equal or exceed the performance of the base model, but for that, we need to increase n_iter even more, which means more compute time.
So currently our top-4 models are:
Evaluate Models
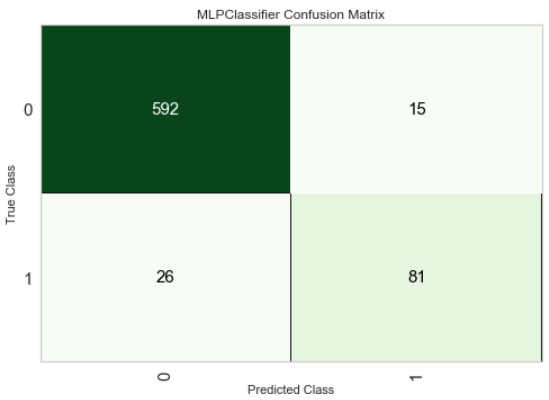
Before moving ahead, let us evaluate the model performance. We will exploit evaluate_model() function of PyCaret to evaluate and highlight important aspects of the winning models.
Confusion Matrix
Feature Importance
Since mlp and catb_tuned do not provide feature importance, we will use *lgbm *to see which features are most important in our predictions:

We can see that Return of Gold in the past 180 days is the most important factor here. This is also intuitive because if the Gold prices have increased a lot in the past, their chances of falling/correcting are higher and vice-versa. The next 3 features are returns from Silver over 250, 60 and 180 days. Again, Silver and Gold are two most widely traded and correlated precious metals, hence the relationship is very intuitive.
Ensemble Models
After having tuned the hyper-parameters of the model, we can try Ensembling methods to improve performance. Two ensembling methods we can try is ‘Bagging’ and ‘Boosting’ . Models that do not provide probability estimates cannot be used for Boosting. Hence, we can use Boosting with ‘lgbm’ and ‘et’ only. For others, we tried bagging to see if there were any improvements in performance or not. Below are the code snapshots and the 10-fold results.
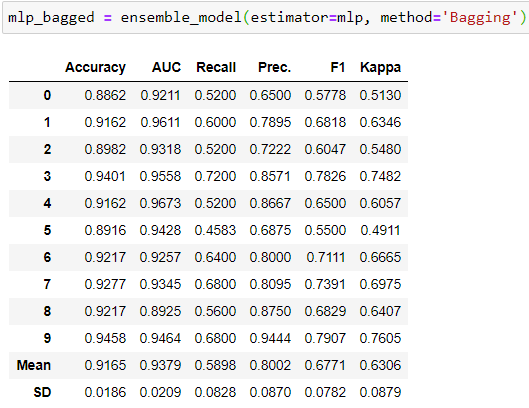
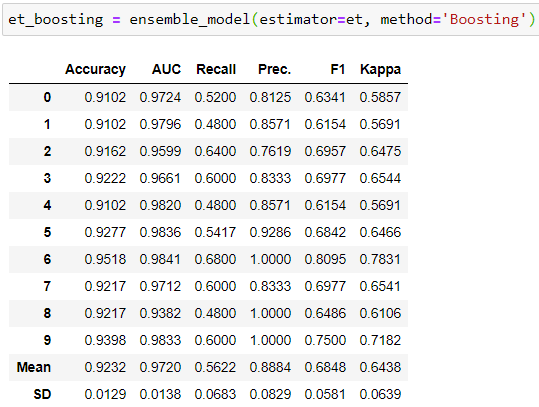
As we can see above, the results did not improve for the two models. For other models as well, there was deterioration in performance (check notebook). Hence our winning model remains the same.
Blending Models
Blending models is basically building a voting classifier on top of estimators. For models that provide prediction probability, we can use soft voting (using their probabilities), while for others, we would use hard-voting. The blend_model() function defaults to using hard voting, which can be changed manually. I built two blends to see if there was some additional performance that can be extracted.


Though none of the models could dethrone ‘mlp’ from top position, it is very interesting to see the second blend, ‘blend2’, which is a soft combination of ‘lgbm’ and ‘et’. The performance on Recall and AUC of 62.25% and 97.43% is higher than both ‘lgbm’ and ‘et’ individually. This exhibits the benefit of blending models. Now our winner models would be reduced to 3.

Stacking models is a method where we allow predictions of one models (or set of models) in one layer to be used as a feature for subsequent layers and finally, the meta-model is allowed to train on the predictions of previous layers and the original features (if restack=True) to make the final prediction. PyCaret has a very easy implementation of this where we can build a stack with one layer and one meta-model using stack_model() or multiple layers and one meta-model using create_stacknet(). I have used a different combination to build different stacks and evaluate performance.

In the first stack, ‘stack1’, I used the under-performing models, catb_tuned and blend2 in the first layer to pass on their predictions to the leader model mlp which would help it to make predictions and the prediction of mlp are used by meta-model ,which is **Logistic-Regression (LR) **here by default, to make the final prediction. Since LR did not do very well with complete data (see compare models results) I used restack=False, which means only the predictions from previous models gets passed to subsequent estimators, not the original features. What we see here is nothing short of magic. The Recall jumps from 66.63% of our best model ‘mlp’ to massive 77.8% and so does AUC and Precision. ‘stack1’ is definitely far superior to all the models we built earlier. Obviously I had to try other configurations as well to see if better performance can be achieved. And I did find a better configuration:

The stack above, ‘stack3, had most resounding success with Recall averaging 80.7%, i.e 14% higher than our winner ‘mlp’ model without sacrificing on Accuracy (95%, an improvement of 3%), AUC (97.34%, an improvement of 2.5%) or Precision (86.28%, improvement of massive 7.7%)
We can use this model to predict on the Test-Data, (30% of the total observations) that we separated at the setup stage. We can do that by using predict_model()

We can see that the performance of the model on test data is even better with **Recall **of 86.9%
Since we have ‘stack3’ as the leading model, we would fit the model on the entire data (including the Test data) and save the model for prediction on new data.
The code above fits the model on entire data and using the save_model() function, I have saved the trained model and the pre-processing pipeline in a pkl file named “22D Classifier” in my active directory. This saved model can and will be called on to predict on new data.
Predicting on New Data
For making prediction we will need to import the raw prices data just the way we did it the beginning of the exercise to extract the features and then load the model to make the predictions. The only difference would be that we would be importing data till the last trading day to make a prediction on the most recent data, just like we would do in real life. The notebook titled ‘Gold Prediction New Data — Classification’ in the repo exhibits the data import, preparation and prediction codes.
We will skip the data import and preparation part (check notebook for details) and see the prediction process.
Using predict_model() we can apply the loaded model on new set of data to generate the prediction (1 or 0) and the score (the probability attached to the prediction). The ‘prediction’ dataframe will also contain all the features that we extracted.
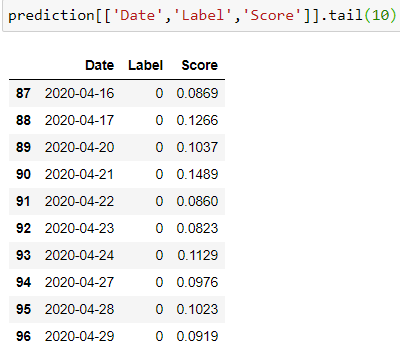
Looking at the Label and Score column of the prediction, the model did not predict a significant fall on any of the days. For example, given the historical returns as of 29th April, the model predicts that a significant fall in Gold Prices over the next 22-Day period is not likely, hence Label = 0, with a probability of a meagre 9.19%.
Conclusion
So here I have walked through steps to create a classifier to predict a significant fall in prices over the next 22-Day period in Gold Prices. The notebook contains codes for 14- Day model as well. You can try to create labels and try to predict similar fall over different windows of time in a similar fashion. Till now, we have created a regression and a classification model. In future, we will try to use the prediction from classification models as features in the regression problem and see if it improves the performance of regression.
Important Links
***Part-I and II — Regression***
***PyCaret***
Last updated
Was this helpful?