Supercharge Your ML with PyCaret and Gradio
Supercharge Your Machine Learning Experiments with PyCaret and Gradio
A step-by-step tutorial to develop and interact with machine learning pipelines rapidly
👉 Introduction
This tutorial is a step-by-step, beginner-friendly explanation of how you can integrate PyCaret and Gradio, the two powerful open-source libraries in Python, and supercharge your machine learning experimentation within minutes.
This tutorial is a “hello world” example, I have used Iris Dataset from UCI, which is a multiclassification problem where the goal is to predict the class of iris plants. The code given in this example can be reproduced on any other dataset, without any major modifications.
👉 PyCaret
PyCaret is an open-source, low-code machine learning library and end-to-end model management tool built-in Python for automating machine learning workflows. It is incredibly popular for its ease of use, simplicity, and ability to build and deploy end-to-end ML prototypes quickly and efficiently.
PyCaret is an alternate low-code library that can be used to replace hundreds of lines of code with few lines only. This makes the experiment cycle exponentially fast and efficient.
PyCaret is simple and easy to use. All the operations performed in PyCaret are sequentially stored in a Pipeline that is fully automated for **deployment. **Whether it’s imputing missing values, one-hot-encoding, transforming categorical data, feature engineering, or even hyperparameter tuning, PyCaret automates all of it.
To learn more about PyCaret, check out their GitHub.
👉 Gradio
Gradio is an open-source Python library for creating customizable UI components around your machine learning models. Gradio makes it easy for you to “play around” with your model in your browser by dragging and dropping in your own images, pasting your own text, recording your own voice, etc., and seeing what the model outputs.
Gradio is useful for:
Creating quick demos around your trained ML pipelines
Getting live feedback on model performance
Debugging your model interactively during development
To learn more about Gradio, check out their GitHub.

👉 Installing PyCaret
Installing PyCaret is very easy and takes only a few minutes. We strongly recommend using a virtual environment to avoid potential conflicts with other libraries.
PyCaret’s default installation is a slim version of pycaret which only installs hard dependencies that are listed here.
When you install the full version of pycaret, all the optional dependencies as listed here are also installed.
👉 Installing Gradio
You can install gradio from pip.
👉 Let’s get started

👉 Initialize Setup

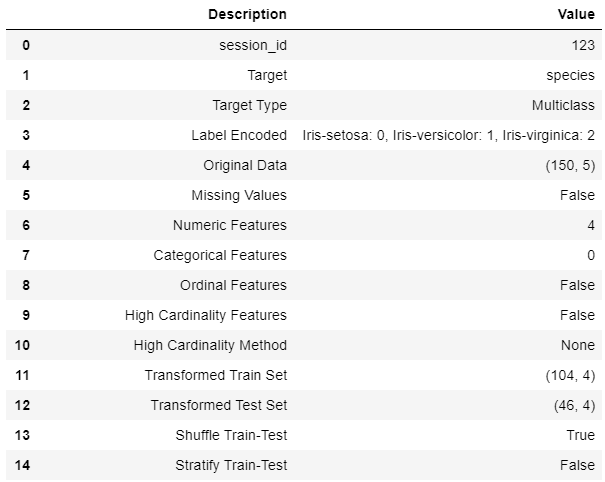
Whenever you initialize the setup function in PyCaret, it profiles the dataset and infers the data types for all input features. In this case, you can see all the four features (sepal_length, sepal_width, petal_length, and petal_width) are identified correctly as Numeric datatype. You can press enter to continue.

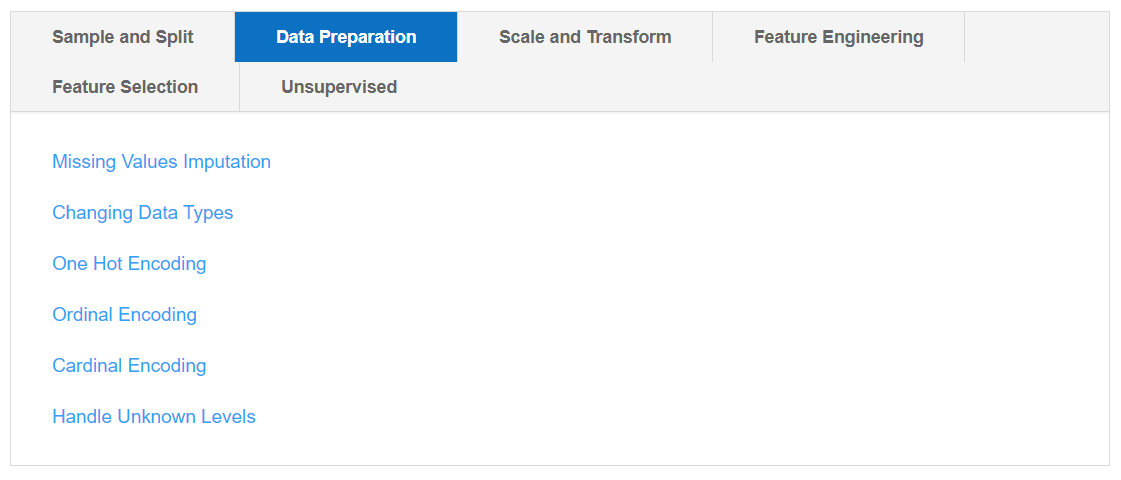
Common to all modules in PyCaret, the setup function is the first and the only mandatory step to start any machine learning experiment in PyCaret. Besides performing some basic processing tasks by default, PyCaret also offers a wide array of pre-processing features such as scaling and transformation, feature engineering, feature selection, and several key data preparatory steps such as one-hot-encoding, missing values imputation, over-sampling/under-sampling, etc. To learn more about all the preprocessing functionalities in PyCaret, you can see this link.

👉 Compare Models
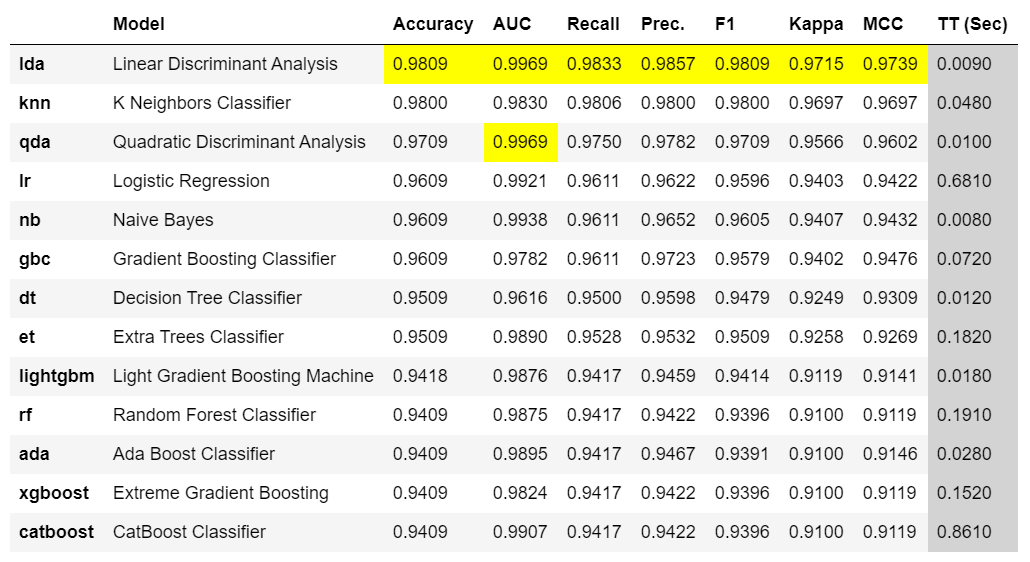
This is the first step we recommend in the workflow of any supervised experiment in PyCaret. This function trains all the available models in the model library using default hyperparameters and evaluates performance metrics using cross-validation.
The output of this function is a table showing the mean cross-validated scores for all the models. The number of folds can be defined using the foldparameter (default = 10 folds). The table is sorted (highest to lowest) by the metric of choice which can be defined using the sortparameter (default = ‘Accuracy’).
n_select parameter in the setup function controls the return of trained models. In this case, I am setting it to 15, meaning return the top 15 models as a list. pull function in the second line stores the output of compare_models as pd.DataFrame .


👉 Gradio
Now that we are done with the modeling process, let’s create a simple UI using Gradio to interact with our models. I will do it in two parts, first I will create a function that will use PyCaret’s predict_model functionality to generate and return predictions and the second part will be feeding that function into Gradio and designing a simple input form for interactivity.
Part I — Creating an internal function
The first two lines of the code take the input features and convert them into pandas DataFrame. Line 7 is creating a unique list of model names displayed in the compare_models output (this will be used as a dropdown in the UI). Line 8 selects the best model based on the index value of the list (which will be passed in through UI) and Line 9 uses the predict_model functionality of PyCaret to score the dataset.
Part II — Creating a UI with Gradio
Line 3 in the code below creates a dropdown for model names, Line 4–7 creates a slider for each of the input features and I have set the default value to the mean of each feature. Line 9 initiates a UI (in the notebook as well as on your local host so you can view it in the browser).

You can see this quick video here to see how easy it is to interact with your pipelines and query your models without writing hundreds of lines of code or developing a full-fledged front-end.
I hope that you will appreciate the ease of use and simplicity in PyCaret and Gradio. In less than 25 lines of code and few minutes of experimentation, I have trained and evaluated multiple models using PyCaret and developed a lightweight UI to interact with models in the Notebook.
Coming Soon!
Next week I will be writing a tutorial on unsupervised anomaly detection on time-series data using PyCaret Anomaly Detection Module. Please follow me on Medium, LinkedIn, and Twitter to get more updates.
There is no limit to what you can achieve using this lightweight workflow automation library in Python. If you find this useful, please do not forget to give us ⭐️ on our GitHub repository.
To hear more about PyCaret follow us on LinkedIn and Youtube.
Join us on our slack channel. Invite link here.
You may also be interested in:
Build your own AutoML in Power BI using PyCaret 2.0 Deploy Machine Learning Pipeline on Azure using Docker Deploy Machine Learning Pipeline on Google Kubernetes Engine Deploy Machine Learning Pipeline on AWS Fargate Build and deploy your first machine learning web app Deploy PyCaret and Streamlit app using AWS Fargate serverless Build and deploy machine learning web app using PyCaret and Streamlit Deploy Machine Learning App built using Streamlit and PyCaret on GKE
Important Links
Documentation Blog GitHub StackOverflow Install PyCaret Notebook Tutorials Contribute in PyCaret
Want to learn about a specific module?
Click on the links below to see the documentation and working examples.
Classification Regression Clustering Anomaly Detection Natural Language Processing Association Rule Mining
Last updated
Was this helpful?