Time Series Anomaly Detection with PyCaret

Time Series Anomaly Detection with PyCaret

A step-by-step tutorial on unsupervised anomaly detection for time series data using PyCaret

👉 Introduction

This is a step-by-step, beginner-friendly tutorial on detecting anomalies in time series data using PyCaret’s Unsupervised Anomaly Detection Module.

Learning Goals of this Tutorial

  • What is Anomaly Detection? Types of Anomaly Detection.

  • Anomaly Detection use-case in business.

  • Training and evaluating anomaly detection model using PyCaret.

  • Label anomalies and analyze the results.

👉 PyCaret

PyCaret is an open-source, low-code machine learning library and end-to-end model management tool built-in Python for automating machine learning workflows. It is incredibly popular for its ease of use, simplicity, and ability to build and deploy end-to-end ML prototypes quickly and efficiently.

PyCaret is an alternate low-code library that can be used to replace hundreds of lines of code with few lines only. This makes the experiment cycle exponentially fast and efficient.

PyCaret is simple and easy to use. All the operations performed in PyCaret are sequentially stored in a Pipeline that is fully automated for **deployment. **Whether it’s imputing missing values, one-hot-encoding, transforming categorical data, feature engineering, or even hyperparameter tuning, PyCaret automates all of it.

To learn more about PyCaret, check out their GitHub.

👉 Installing PyCaret

Installing PyCaret is very easy and takes only a few minutes. We strongly recommend using a virtual environment to avoid potential conflicts with other libraries.

PyCaret’s default installation is a slim version of pycaret which only installs hard dependencies that are listed here.

**# install slim version (default)
**pip install pycaret

**# install the full version**
pip install pycaret[full]

When you install the full version of pycaret, all the optional dependencies as listed here are also installed.

👉 What is Anomaly Detection

Anomaly Detection is a technique used for identifying rare items, events, or observations that raise suspicions by differing significantly from the majority of the data.

Typically, the anomalous items will translate to some kind of problem such as:

  • bank fraud,

  • structural defect,

  • medical problem,

  • Error, etc.

Anomaly detection algorithms can broadly be categorized into these groups:

**(a) Supervised: **Used when the data set has labels identifying which transactions are an anomaly and which are normal. (this is similar to a supervised classification problem).

**(b) Unsupervised: **Unsupervised means no labels and a model is trained on the complete data and assumes that the majority of the instances are normal.

(c) Semi-Supervised: A model is trained on normal data only (without any anomalies). When the trained model used on the new data points, it can predict whether the new data point is normal or not (based on the distribution of the data in the trained model).

👉 PyCaret Anomaly Detection Module

PyCaret’s **Anomaly Detection** Module is an unsupervised machine learning module that is used for identifying rare items, events, or **observations. **It provides over 15 algorithms and several plots to analyze the results of trained models.

👉 Dataset

I will be using the NYC taxi passengers dataset that contains the number of taxi passengers from July 2014 to January 2015 at half-hourly intervals. You can download the dataset from here.

import pandas as pd
data = pd.read_csv('[https://raw.githubusercontent.com/numenta/NAB/master/data/realKnownCause/nyc_taxi.csv](https://raw.githubusercontent.com/numenta/NAB/master/data/realKnownCause/nyc_taxi.csv)')

data['timestamp'] = pd.to_datetime(data['timestamp'])

data.head()
**# create moving-averages
**data['MA48'] = data['value'].rolling(48).mean()
data['MA336'] = data['value'].rolling(336).mean()

# plot 
import plotly.express as px
fig = px.line(data, x="timestamp", y=['value', 'MA48', 'MA336'], title='NYC Taxi Trips', template = 'plotly_dark')
fig.show()

👉 Data Preparation

Since algorithms cannot directly consume date or timestamp data, we will extract the features from the timestamp and will drop the actual timestamp column before training models.

**# drop moving-average columns
**data.drop(['MA48', 'MA336'], axis=1, inplace=True)

**# set timestamp to index**
data.set_index('timestamp', drop=True, inplace=True)

**# resample timeseries to hourly **
data = data.resample('H').sum()

**# creature features from date**
data['day'] = [i.day for i in data.index]
data['day_name'] = [i.day_name() for i in data.index]
data['day_of_year'] = [i.dayofyear for i in data.index]
data['week_of_year'] = [i.weekofyear for i in data.index]
data['hour'] = [i.hour for i in data.index]
data['is_weekday'] = [i.isoweekday() for i in data.index]

data.head()

👉 Experiment Setup

Common to all modules in PyCaret, the setup function is the first and the only mandatory step to start any machine learning experiment in PyCaret. Besides performing some basic processing tasks by default, PyCaret also offers a wide array of pre-processing features. To learn more about all the preprocessing functionalities in PyCaret, you can see this link.

**# init setup**
from pycaret.anomaly import *
s = setup(data, session_id = 123)

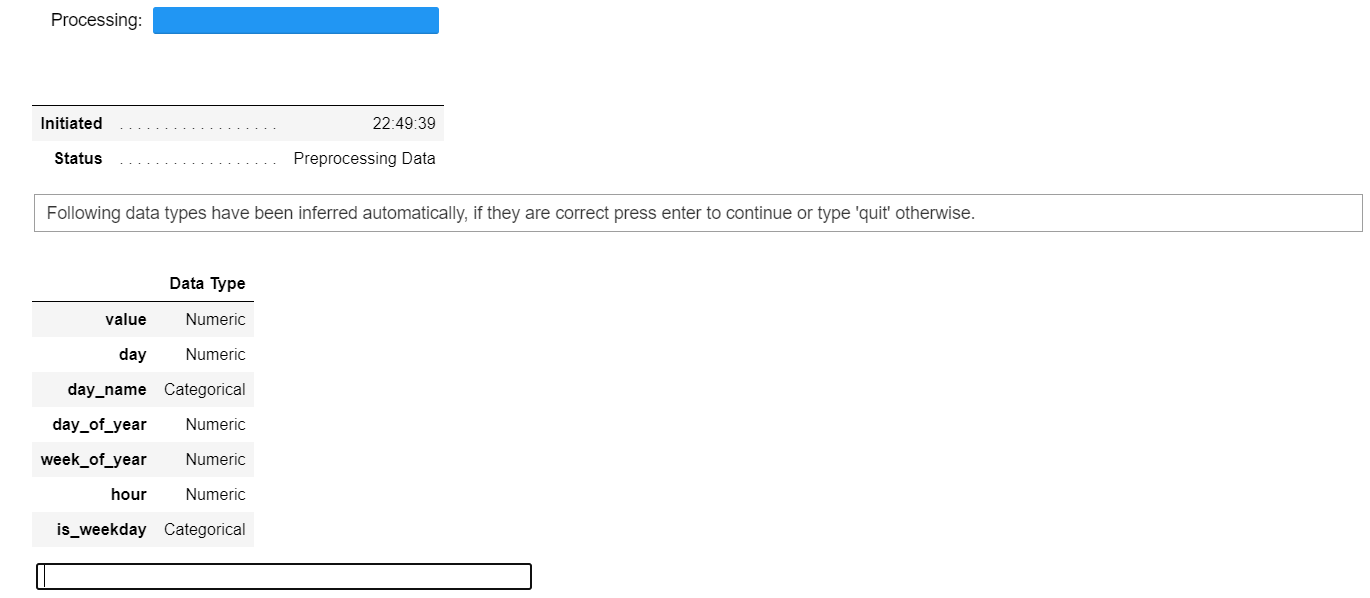
Whenever you initialize the setup function in PyCaret, it profiles the dataset and infers the data types for all input features. In this case, you can see day_name and is_weekday is inferred as categorical and remaining as numeric. You can press enter to continue.

👉 Model Training

To check the list of all available algorithms:

**# check list of available models**
models()

In this tutorial, I am using Isolation Forest, but you can replace the ID ‘iforest’ in the code below with any other model ID to change the algorithm. If you want to learn more about the Isolation Forest algorithm, you can refer to this.

**# train model
**iforest = create_model('iforest', fraction = 0.1)
iforest_results = assign_model(iforest)
iforest_results.head()

Notice that two new columns are appended i.e. **Anomaly **that contains value 1 for outlier and 0 for inlier and **Anomaly_Score **which is a continuous value a.k.a as decision function (internally, the algorithm calculates the score based on which the anomaly is determined).

**# check anomalies
**iforest_results[iforest_results['Anomaly'] == 1].head()

We can now plot anomalies on the graph to visualize.

import plotly.graph_objects as go

**# plot value on y-axis and date on x-axis**
fig = px.line(iforest_results, x=iforest_results.index, y="value", title='NYC TAXI TRIPS - UNSUPERVISED ANOMALY DETECTION', template = 'plotly_dark')

**# create list of outlier_dates**
outlier_dates = iforest_results[iforest_results['Anomaly'] == 1].index

**# obtain y value of anomalies to plot**
y_values = [iforest_results.loc[i]['value'] for i in outlier_dates]

fig.add_trace(go.Scatter(x=outlier_dates, y=y_values, mode = 'markers', 
                name = 'Anomaly', 
                marker=dict(color='red',size=10)))
        
fig.show()

Notice that the model has picked several anomalies around Jan 1st which is a new year eve. The model has also detected a couple of anomalies around Jan 18— Jan 22 which is when the North American blizzard** **(a ****fast-moving disruptive blizzard) moved through the Northeast dumping 30 cm in areas around the New York City area.

If you google the dates around the other red points on the graph, you will probably be able to find the leads on why those points were picked up as anomalous by the model (hopefully).

I hope you will appreciate the ease of use and simplicity in PyCaret. In just a few lines of code and few minutes of experimentation, I have trained an unsupervised anomaly detection model and have labeled the dataset to detect anomalies on a time series data.

Coming Soon!

Next week I will be writing a tutorial on training custom models in PyCaret using PyCaret Regression Module. You can follow me on Medium, LinkedIn, and Twitter to get instant notifications whenever a new tutorial is released.

There is no limit to what you can achieve using this lightweight workflow automation library in Python. If you find this useful, please do not forget to give us ⭐️ on our GitHub repository.

To hear more about PyCaret follow us on LinkedIn and Youtube.

Join us on our slack channel. Invite link here.

You may also be interested in:

Build your own AutoML in Power BI using PyCaret 2.0 Deploy Machine Learning Pipeline on Azure using Docker Deploy Machine Learning Pipeline on Google Kubernetes Engine Deploy Machine Learning Pipeline on AWS Fargate Build and deploy your first machine learning web app Deploy PyCaret and Streamlit app using AWS Fargate serverless Build and deploy machine learning web app using PyCaret and Streamlit Deploy Machine Learning App built using Streamlit and PyCaret on GKE

Documentation Blog GitHub StackOverflow Install PyCaret Notebook Tutorials Contribute in PyCaret

Want to learn about a specific module?

Click on the links below to see the documentation and working examples.

Classification Regression Clustering Anomaly Detection Natural Language Processing Association Rule Mining

Last updated