Time Series 101 - For beginners
Time Series 101 — For beginners
A beginner-friendly introduction to Time Series Forecasting
👉 What is Time Series Data?
Time series data is data collected on the same subject at different points in time, such as GDP of a country by year, a stock price of a particular company over a period of time, or your own heartbeat recorded at each second, as a matter of fact, anything that you can capture continuously at different time-intervals is a time series data.
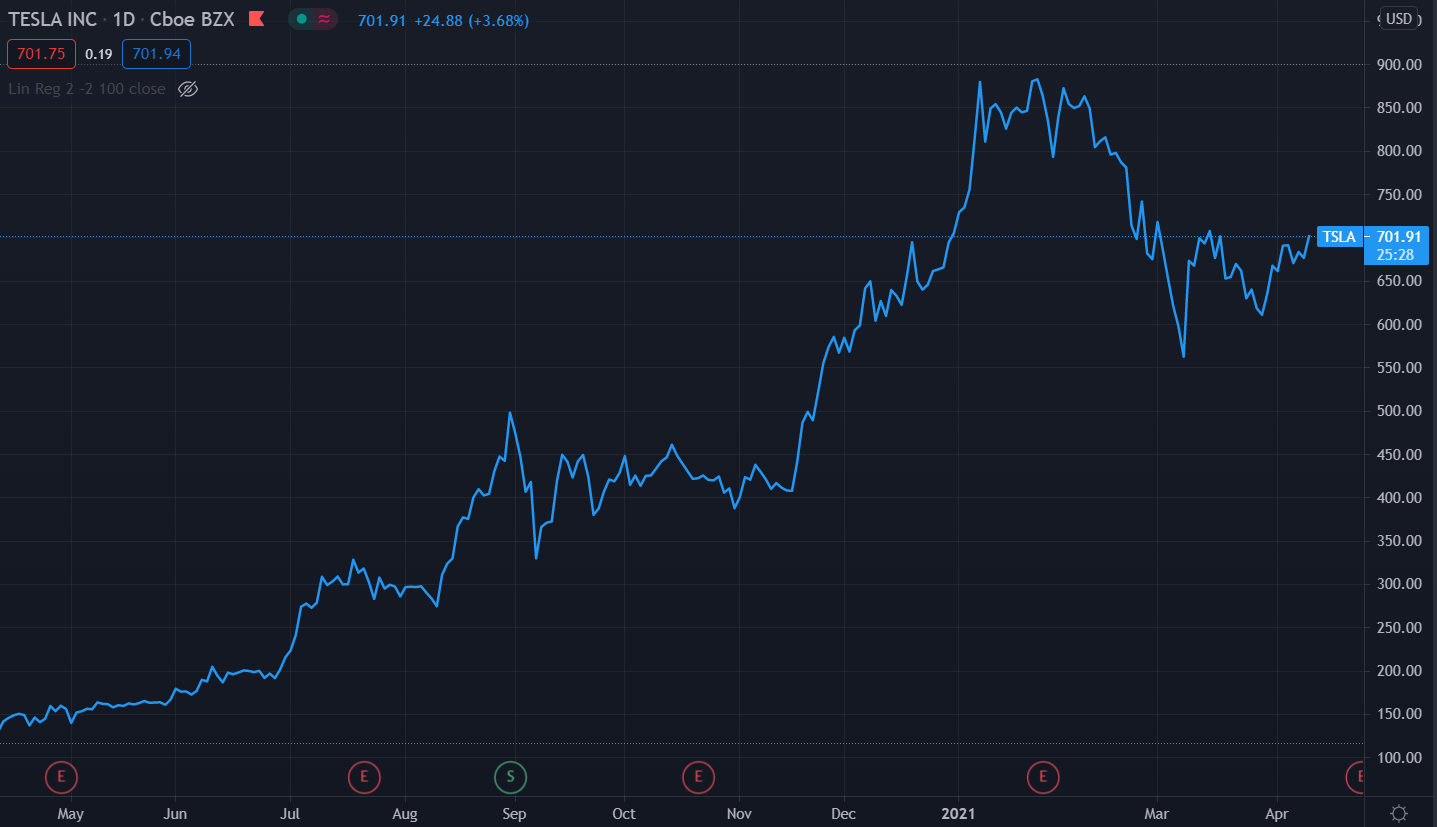
See below as an example of time series data, the chart below is the daily stock price of Tesla Inc. (Ticker Symbol: TSLA) for last year. The y-axis on the right-hand side is the value in US$ (The last point on the chart i.e. $701.91 is the latest stock price as of the writing of this article on April 12, 2021).
On the other hand, more conventional datasets such as customer information, product information, company information, etc. which store information at a single point in time are known as cross-sectional data.
See the example below of a dataset that tracks America’s best-selling electric cars in the first half of 2020. Notice that instead of tracking the cars sold over a period of time, the chart below tracks different cars such as Tesla, Chevy, and Nissan in the same time period.

It is not very hard to distinguish the difference between cross-sectional and time-series data as the objective of analysis for both datasets are widely different. For the first analysis, we were interested in tracking Tesla stock price over a period of time, whereas for the latter, we wanted to analyze different companies in the same time period i.e. first half of 2020.
However, a typical real-world dataset is likely to be a hybrid. Imagine a retailer like Walmart that sold thousand’s of products every day. If you analyze the sale by-product on a particular day, for example, if you want to find out what’s the number 1 selling item on Christmas eve, this will be a cross-sectional analysis. As opposed to, If you want to find out the sale of one particular item such as PS4 over a period of time (let’s say last 5 years), this now becomes a time-series analysis.
Precisely, the objective of the analysis for time-series and cross-sectional data is different and a real-world dataset is likely to be a hybrid of both time-series as well as cross-sectional data.
👉 What is Time Series Forecasting?
Time series forecasting is exactly what it sounds like i.e. predicting the future unknown values. However, unlike sci-fi movies, it’s a little less thrilling in the real world. It involves the collection of historical data, preparing it for algorithms to consume (the algorithm is simply put the maths that goes behind the scene), and then predict the future values based on patterns learned from the historical data.
Can you think of a reason why would companies or anybody be interested in forecasting future values for any time series (GDP, monthly sales, inventory, unemployment, global temperatures, etc.). Let me give you some business perspective:
A retailer may be interested in predicting future sales at an SKU level for planning and budgeting.
A small merchant may be interested in forecasting sales by store, so it can schedule the right resources (more people during busy periods and vice versa).
A software giant like Google may be interested in knowing the busiest hour of the day or busiest day of the week so that it can schedule server resources accordingly.
The health department may be interested in predicting the cumulative COVID vaccination administered so that it can know the point of consolidation where herd immunity is expected to kick in.
👉 Time Series Forecasting Methods
Time series forecasting can broadly be categorized into the following categories:
Classical / Statistical Models — Moving Averages, Exponential smoothing, ARIMA, SARIMA, TBATS
**Machine Learning **— Linear Regression, XGBoost, Random Forest, or any ML model with reduction methods
**Deep Learning **— RNN, LSTM
This tutorial is focused on forecasting time series using Machine Learning. For this tutorial, I will use the Regression Module of an open-source, low-code machine library in Python called PyCaret. If you haven’t used PyCaret before, you can get quickly started here. Although, you don’t require any prior knowledge of PyCaret to follow along with this tutorial.
👉 PyCaret Regression Module
PyCaret Regression Module is a supervised machine learning module used for estimating the relationships between a dependent variable (often called the ‘outcome variable’, or ‘target’) and one or more independent variables (often called ‘features’, or ‘predictors’).
The objective of regression is to predict continuous values such as sales amount, quantity, temperature, number of customers, etc. All modules in PyCaret provide many pre-processing features to prepare the data for modeling through the setup function. It has over 25 ready-to-use algorithms and several plots to analyze the performance of trained models.
👉 Dataset
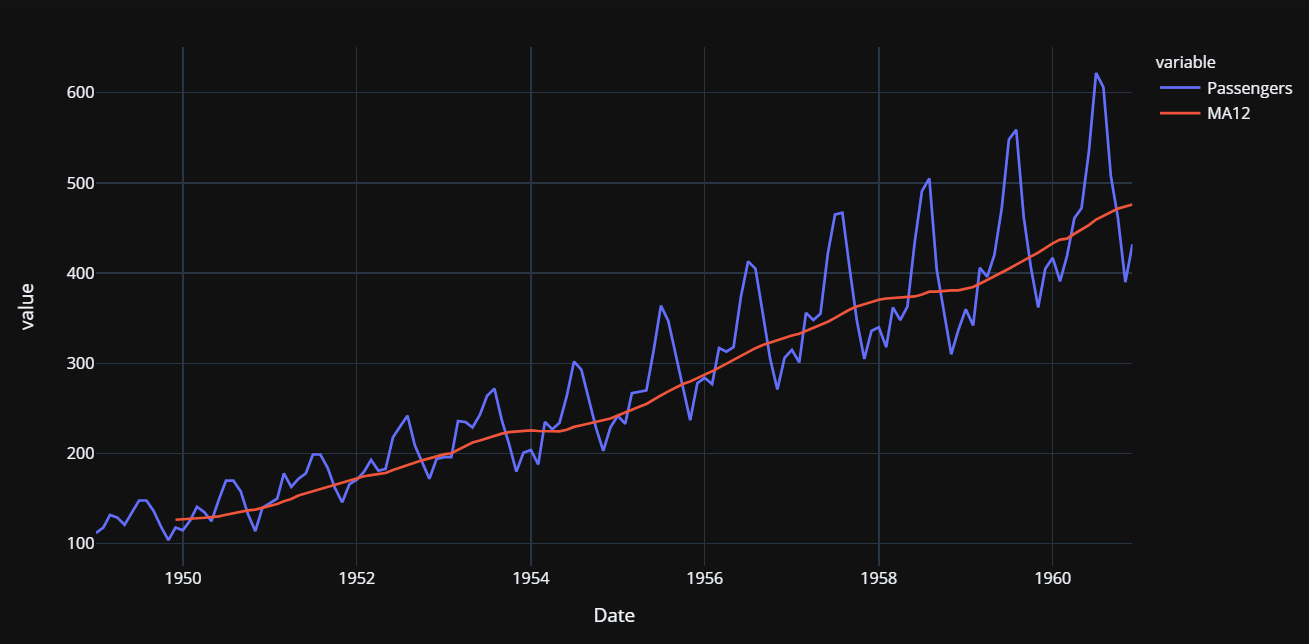
For this tutorial, I have used the US airline passengers dataset. You can download the dataset from Kaggle. This dataset provides monthly totals of US airline passengers from 1949 to 1960.
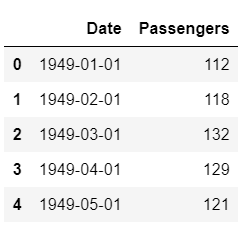
Since machine learning algorithms cannot directly deal with dates, let’s extract some simple features from dates such as month and year, and drop the original date column.
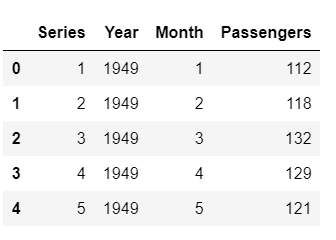
I have manually split the dataset before initializing the setup . An alternate would be to pass the entire dataset to PyCaret and let it handle the split, in which case you will have to pass data_split_shuffle = False in the setup function to avoid shuffling the dataset before the split.
👉 Initialize Setup
Now it’s time to initialize the setup function, where we will explicitly pass the training data, test data, and cross-validation strategy using the fold_strategy parameter.
👉 Train and Evaluate all Models
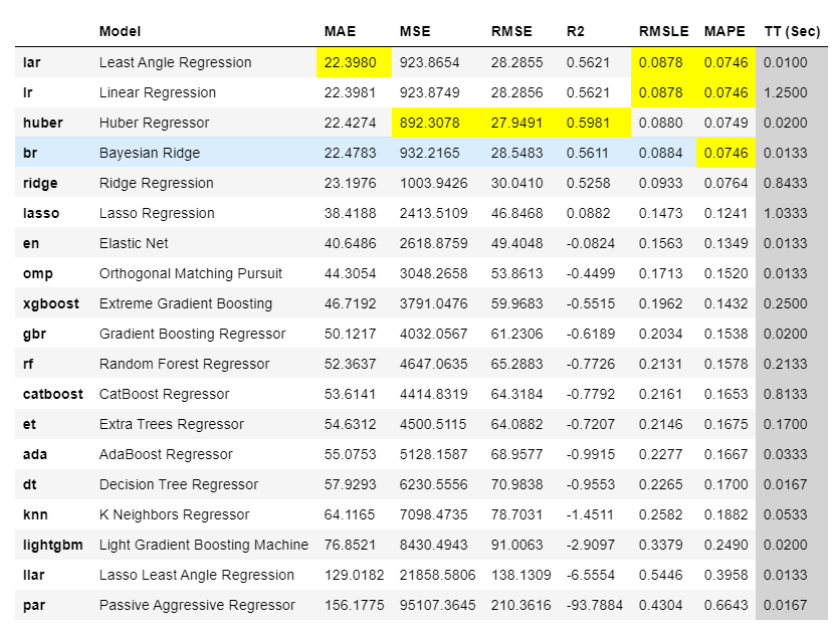
The best model based on cross-validated MAE is **Least Angle Regression **(MAE: 22.3). Let’s check the score on the test set.

MAE on the test set is 12% higher than the cross-validated MAE. Not so good, but we will work with it. Let’s plot the actual and predicted lines to visualize the fit.
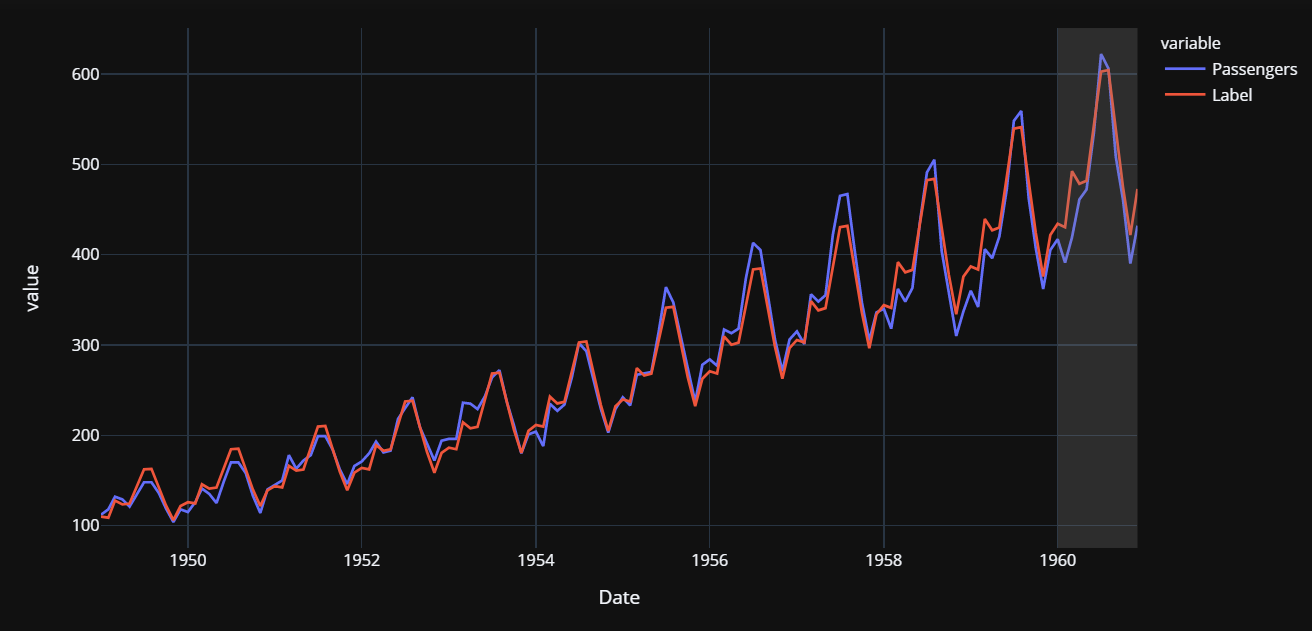
The grey backdrop towards the end is the test period (i.e. 1960). Now let’s finalize the model i.e. train the best model i.e. Least Angle Regression on the entire dataset (this time, including the test set).
👉 Create a future scoring dataset
Now that we have trained our model on the entire dataset (1949 to 1960), let’s predict five years out in the future through 1964. To use our final model to generate future predictions, we first need to create a dataset consisting of the Month, Year, Series column on the future dates.
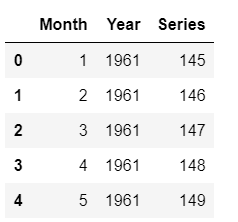
Now, let’s use the future_df to score and generate predictions.
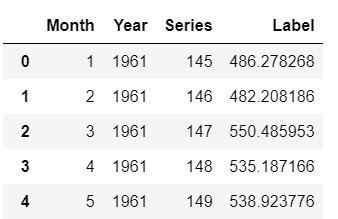
👉 Plot the actual data and predictions
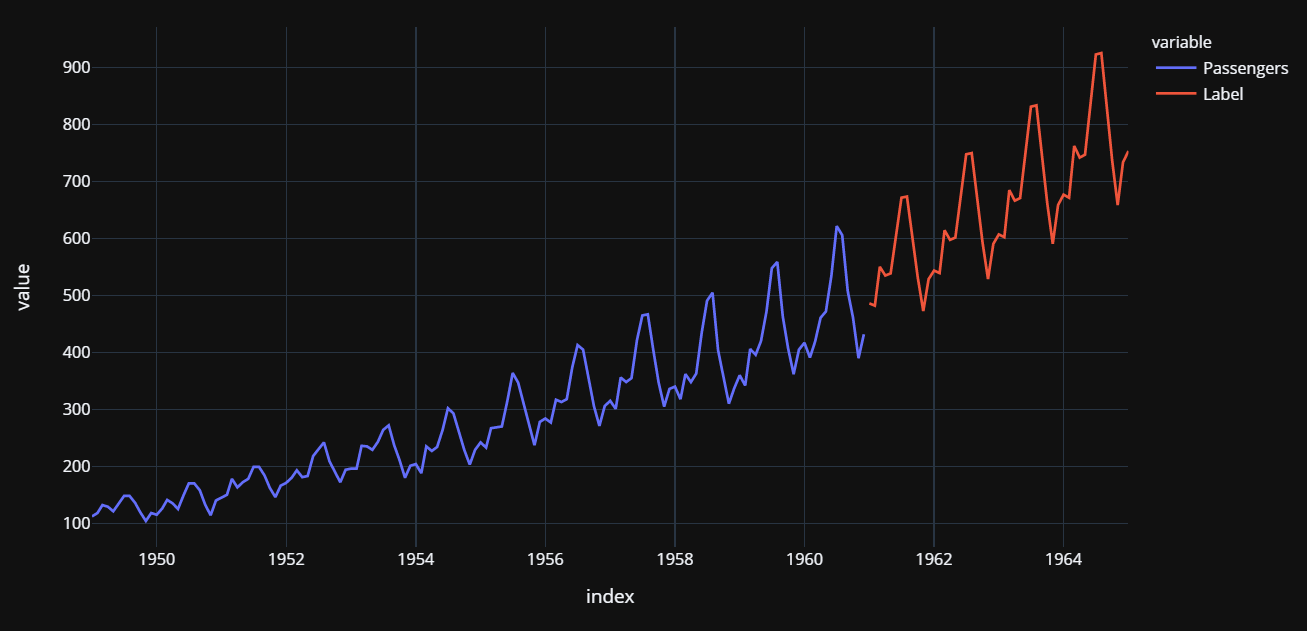
I hope you find this tutorial easy. If you think you are ready for the next level, you can check out my advanced time-series tutorial on Multiple Time Series Forecasting with PyCaret.
Coming Soon!
I will soon be writing a tutorial on unsupervised anomaly detection on time-series data using PyCaret Anomaly Detection Module. If you would like to get more updates, you can follow me on Medium, LinkedIn, and Twitter.
There is no limit to what you can achieve using this lightweight workflow automation library in Python. If you find this useful, please do not forget to give ⭐️ on our GitHub repository.
To learn more about PyCaret follow us on LinkedIn and Youtube.
Join us on our slack channel. Invite link here.
You may also be interested in:
Build your own AutoML in Power BI using PyCaret 2.0 Deploy Machine Learning Pipeline on Azure using Docker Deploy Machine Learning Pipeline on Google Kubernetes Engine Deploy Machine Learning Pipeline on AWS Fargate Build and deploy your first machine learning web app Deploy PyCaret and Streamlit app using AWS Fargate serverless Build and deploy machine learning web app using PyCaret and Streamlit Deploy Machine Learning App built using Streamlit and PyCaret on GKE
Important Links
Documentation Blog GitHub StackOverflow Install PyCaret Notebook Tutorials Contribute in PyCaret
Want to learn about a specific module?
Click on the links below to see the documentation and working examples.
Classification Regression Clustering Anomaly Detection Natural Language Processing Association Rule Mining
Last updated
Was this helpful?