Machine Learning in Power BI using PyCaret
Machine Learning in Power BI using PyCaret
A step-by-step tutorial for implementing machine learning in Power BI within minutes
by Moez Ali

PyCaret 1.0.0
Last week we announced PyCaret, an open source machine learning library in Python that trains and deploys machine learning models in a **low-code **environment. In our previous post we demonstrated how to use PyCaret in Jupyter Notebook to train and deploy machine learning models in Python.
In this post we present a step-by-step tutorial on how PyCaret can be integrated within Power BI, thus allowing analysts and data scientists to add a layer of machine learning to their Dashboards and Reports without any additional license or software costs. PyCaret is an open source and **free to use **Python library that comes with a wide range of functions that are exclusively built to work within Power BI.
By the end of this article you will learn how to implement the following in Power BI:
Clustering — Group data points with similar characteristics.
**Anomaly Detection **— Identify rare observations / outliers in the data.
**Natural Language Processing **— Analyze text data via topic modeling.
**Association Rule Mining **— Find interesting relationships in the data.
**Classification **— Predict categorical class labels that are binary (1 or 0).
**Regression **— Predict continuous value such as Sales, Price etc
“PyCaret is democratizing machine learning and the use of advanced analytics by providing free, open source, and low-code machine learning solution for business analysts, domain experts, citizen data scientists, and experienced data scientists”.
Microsoft Power BI
Power BI is a business analytics solution that lets you visualize your data and share insights across your organization, or embed them in your app or website. In this tutorial, we will use Power BI Desktop for machine learning by importing the PyCaret library into Power BI.
Before we start
If you have used Python before, it is likely that you already have Anaconda Distribution installed on your computer. If not, click here to download Anaconda Distribution with Python 3.7 or greater.

Setting up the Environment
Before we start using PyCaret’s machine learning capabilities in Power BI we have to create a virtual environment and install pycaret. It’s a three-step process:
✅ Step 1 — Create an anaconda environment
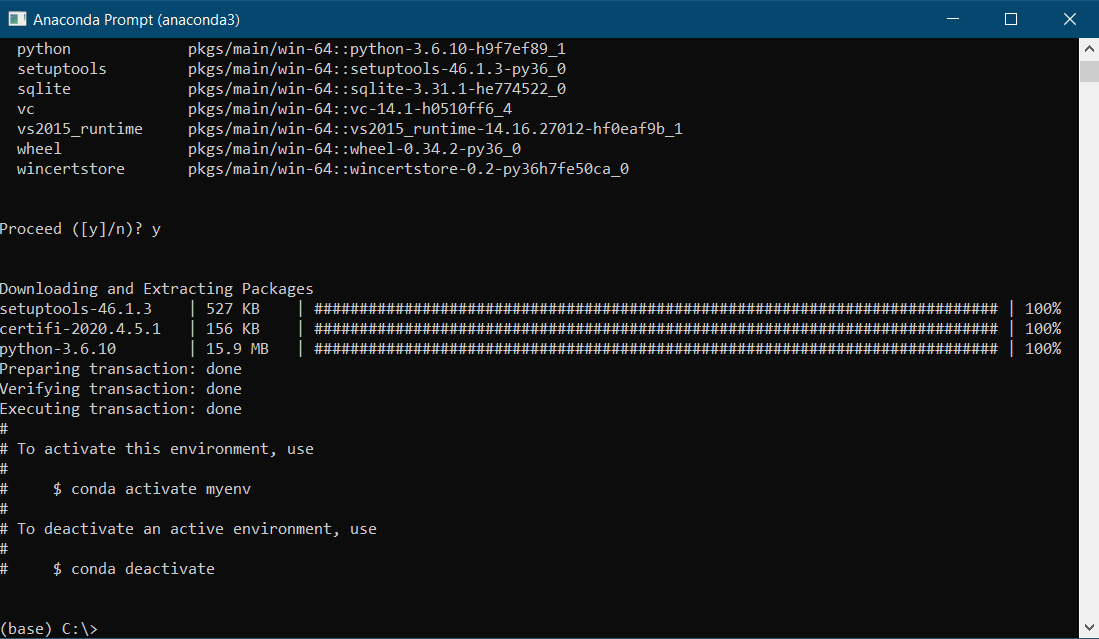
Open **Anaconda Prompt **from start menu and run the following code:
✅ Step 2 — Install PyCaret
Run the following code in Anaconda Prompt:
Installation may take 10 – 15 minutes.
✅Step 3 — Set Python Directory in Power BI
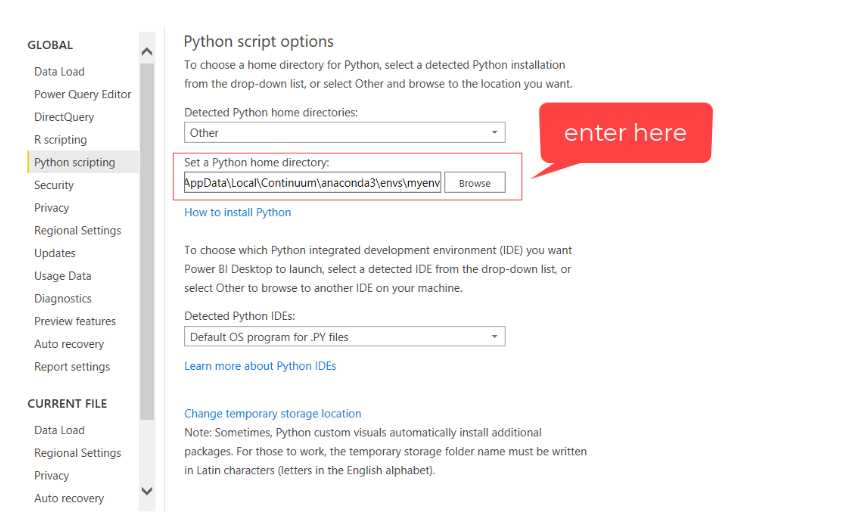
The virtual environment created must be linked with Power BI. This can be done using Global Settings in Power BI Desktop (File → Options → Global → Python scripting). Anaconda Environment by default is installed under:
C:\Users*username*\AppData\Local\Continuum\anaconda3\envs\myenv
📘 Example 1 — Clustering in Power BI
Clustering is a machine learning technique that groups data points with similar characteristics. These groupings are useful for exploring data, identifying patterns and analyzing a subset of data. Some common business use cases for clustering are:
✔ Customer segmentation for the purpose of marketing.
✔ Customer purchasing behavior analysis for promotions and discounts.
✔ Identifying geo-clusters in an epidemic outbreak such as COVID-19.
In this tutorial we will use ‘jewellery.csv’ file that is available on PyCaret’s github repository. You can load the data using a web connector. (Power BI Desktop → Get Data → From Web).
**Link to csv File: **https://raw.githubusercontent.com/pycaret/pycaret/master/datasets/jewellery.csv


K-Means Clustering
To train a clustering model we will execute Python script in Power Query Editor (Power Query Editor → Transform → Run python script).

Run the following code as a Python script:

Output:

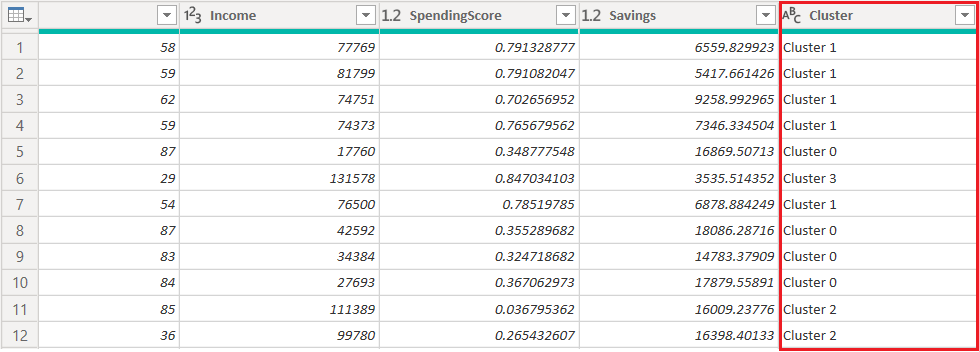
A new column **‘Cluster’ **containing label is attached to the original table.
Once you apply the query (Power Query Editor → Home → Close & Apply), Here is how you can visualize the clusters in Power BI:

By default, PyCaret trains a K-Means clustering model with 4 clusters (i.e. all the data points in the table are categorized into 4 groups). Default values can be changed easily:
To change the number of clusters you can use ***num_clusters ***parameter within **get_clusters( ) **function.
To change model type use ***model ***parameter within get_clusters( ).
See the following example code of training K-Modes model with 6 clusters:
There are 9 ready-to-use clustering algorithms available in PyCaret:

All the preprocessing tasks necessary to train a clustering model such as missing value imputation (if table has any missing or *null *values), or normalization, or one-hot-encoding, they all are automatically performed before training a clustering model. Click here to learn more about PyCaret’s preprocessing capabilities.
💡 In this example we have used the **get_clusters( ) **function to assign cluster labels in the original table. Every time the query is refreshed, clusters are recalculated. An alternate way to implement this would be to use the predict_model( ) function to predict cluster labels using a **pre-trained model **in Python or in Power BI (see Example 5 below to see how to train machine learning models in Power BI environment).
💡 If you want to learn how to train a clustering model in Python using Jupyter Notebook, please see our Clustering 101 Beginner’s Tutorial. (no coding background needed).
📘 Example 2 — Anomaly Detection in Power BI
Anomaly Detection is a machine learning technique used for identifying rare items, events, **or observations **by checking for rows in the table that differ significantly from the majority of the rows. Typically, the anomalous items will translate to some kind of problem such as bank fraud, a structural defect, medical problem or error. Some common business use cases for anomaly detection are:
✔ Fraud detection (credit cards, insurance, etc.) using financial data.
✔ Intrusion detection (system security, malware) or monitoring for network traffic surges and drops.
✔ Identifying multivariate outliers in the dataset.
In this tutorial we will use ‘anomaly.csv’ file available on PyCaret’s github repository. You can load the data using a web connector. (Power BI Desktop → Get Data → From Web).
**Link to csv file: **https://raw.githubusercontent.com/pycaret/pycaret/master/datasets/anomaly.csv

K-Nearest Neighbors Anomaly Detector
Similar to clustering, we will run Python script from Power Query Editor (Transform → Run python script) to train an anomaly detection model. Run the following code as a Python script:

Output:

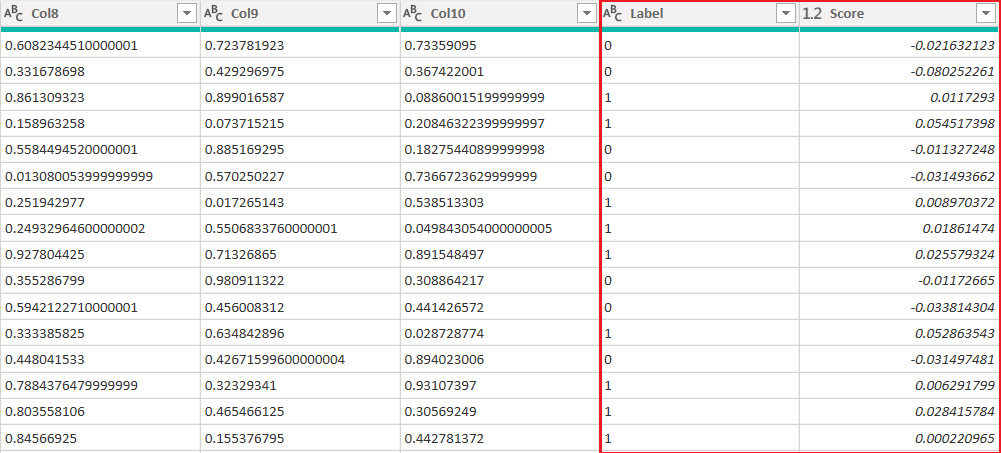
Two new columns are attached to the original table. Label (1 = outlier, 0 = inlier) and Score (data points with high scores are categorized as outlier).
Once you apply the query, here is how you can visualize the results from anomaly detection in Power BI:
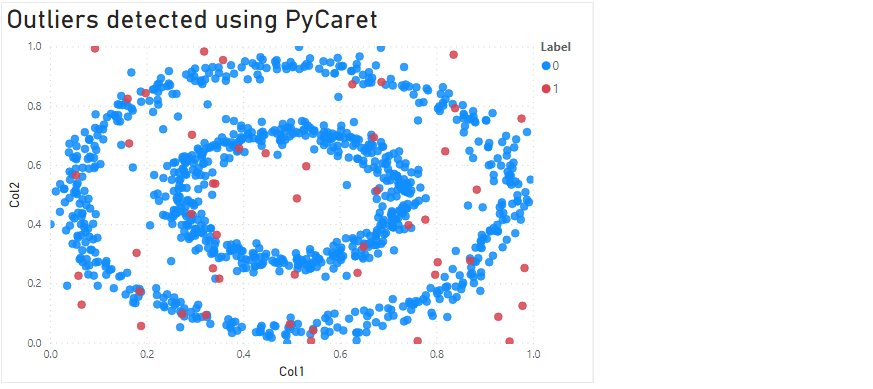
By default, PyCaret trains a K-Nearest Neighbors Anomaly Detector with 5% fraction (i.e. 5% of the total number of rows in the table will be flagged as outlier). Default values can be changed easily:
To change the fraction value you can use ***fraction ***parameter within **get_outliers( ) **function.
To change model type use ***model ***parameter within get_outliers( ).
See the following code for training an Isolation Forest model with 0.1 fraction:
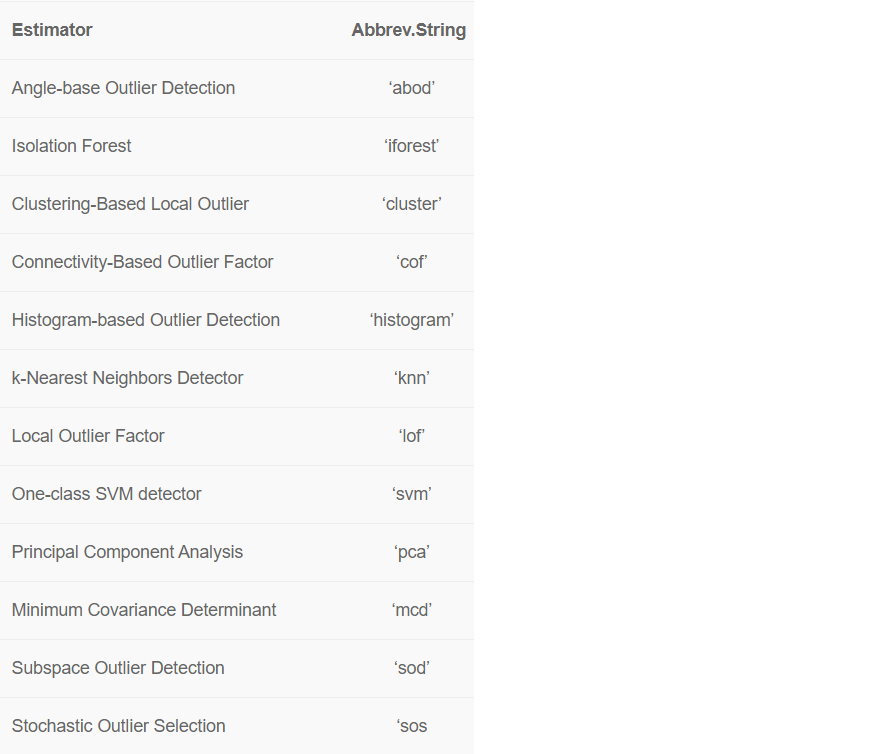
There are over 10 ready-to-use anomaly detection algorithms in PyCaret:
All the preprocessing tasks necessary to train an anomaly detection model such as missing value imputation (if table has any missing or *null *values), or normalization, or one-hot-encoding, they all are automatically performed before training an anomaly detection model. Click here to learn more about PyCaret’s preprocessing capabilities.
💡 In this example we have used the **get_outliers( ) **function to assign outlier label and score for analysis. Every time the query is refreshed, outliers are recalculated. An alternate way to implement this would be to use the predict_model( ) function to predict outliers using a pre-trained model in Python or in Power BI (see Example 5 below to see how to train machine learning models in Power BI environment).
💡 If you want to learn how to train an anomaly detector in Python using Jupyter Notebook, please see our Anomaly Detection 101 Beginner’s Tutorial. (no coding background needed).
📘 Example 3 — Natural Language Processing
Several techniques are used to analyze text data among which **Topic Modeling **is a popular one. A topic model is a type of statistical model for discovering the abstract topics in a collection of documents. Topic modeling is a frequently used text-mining tool for the discovery of hidden semantic structures in a text data.
In this tutorial we will use ****the **‘kiva.csv’ **file available on PyCaret’s github repository. You can load the data using a web connector. (Power BI Desktop → Get Data → From Web).
**Link to csv file: **https://raw.githubusercontent.com/pycaret/pycaret/master/datasets/kiva.csv
Latent Dirichlet Allocation
Run the following code as a Python script in Power Query Editor:
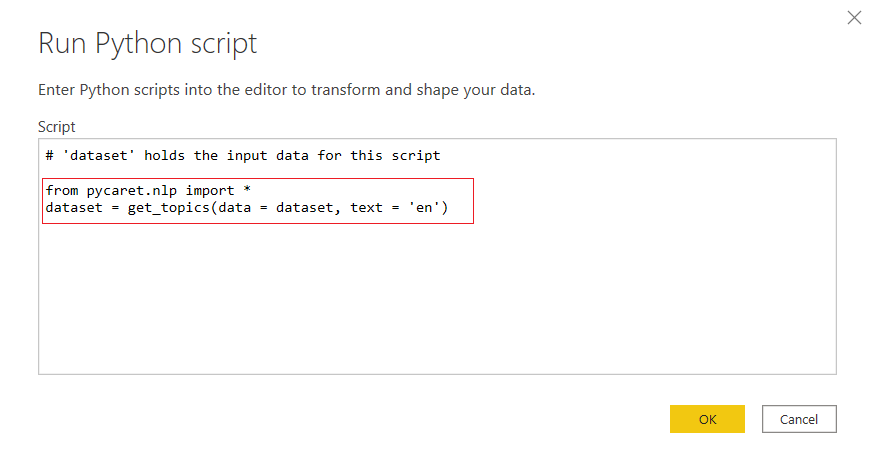
‘en’ is the name of the column containing text in the table ‘kiva’.
Output:


Once the code is executed, new columns with weight of topics and dominant topic are attached to the original table. There are many ways to visualize the output of Topic Models in Power BI. See an example below:
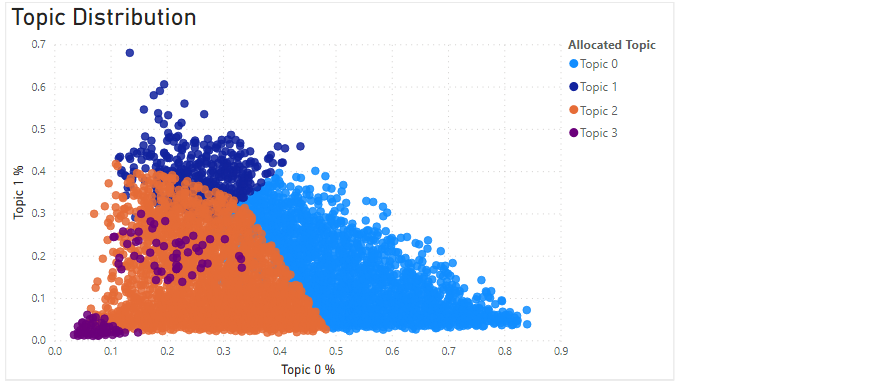
By default, PyCaret trains a Latent Dirichlet Allocation model with 4 topics. Default values can be changed easily:
To change the number of topics you can use the ***num_topics ***parameter within **get_topics( ) **function.
To change model type use the ***model ***parameter within the get_topics( ).
See the example code for training a Non-Negative Matrix Factorization Model with 10 topics:
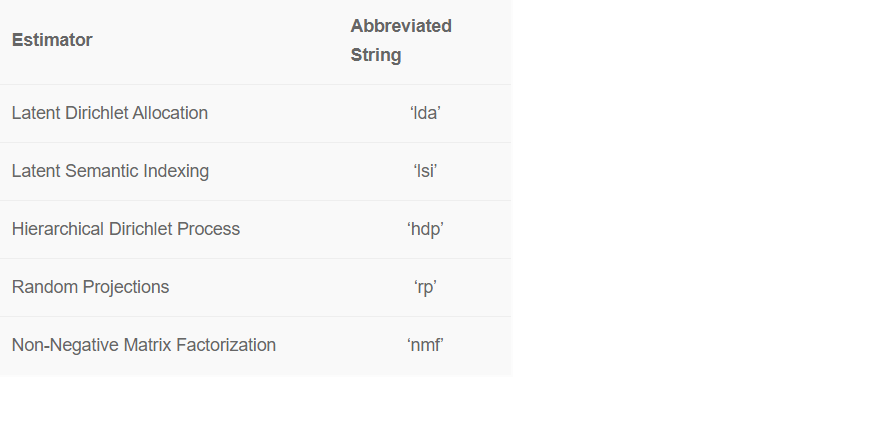
PyCaret has following ready-to-use algorithms for topic modeling:
📘 Example 4— Association Rule Mining in Power BI
Association Rule Mining ****is a **rule-based machine learning **technique for discovering interesting relations between variables in a database. It is intended to identify strong rules using measures of interestingness. Some common business use cases for association rule mining are:
✔ Market Basket Analysis to understand items frequently bought together.
✔ Medical Diagnosis to assist physicians in determining occurrence probability of illness given factors and symptoms.
In this tutorial we will use the ‘france.csv’ file available on PyCaret’s github repository. You can load the data using a web connector. (Power BI Desktop → Get Data → From Web).
**Link to csv file: **https://raw.githubusercontent.com/pycaret/pycaret/master/datasets/france.csv

Apriori Algorithm
It should be clear by now that all PyCaret functions are executed as Python script in Power Query Editor (Transform → Run python script). Run the following code to train an association rule model using the Apriori algorithm:

‘InvoiceNo’ is the column containing transaction id and ‘Description’ contains the variable of interest i.e. the Product name.
Output:


It returns a table with antecedents and consequents with related metrics such as support, confidence, lift etc. Click here to learn more about Association Rules Mining in PyCaret.
📘 Example 5 — Classification in Power BI
Classification is a supervised machine learning technique used to predict the categorical class labels (also known as binary variables). Some common business use case of classification are:
✔ Predicting customer loan / credit card default.
✔ Predicting customer churn (whether the customer will stay or leave)
✔ Predicting patient outcome (whether patient has disease or not)
In this tutorial we will use **‘employee.csv’ **file available on PyCaret’s github repository. You can load the data using a web connector. (Power BI Desktop → Get Data → From Web).
**Link to csv file: **https://raw.githubusercontent.com/pycaret/pycaret/master/datasets/employee.csv
**Objective: **The table ‘employee’ contains information of 15,000 active employees in a company such as time spent at the company, average monthly hours worked, promotion history, department etc. Based on all of these columns (also known as features in machine learning terminology) the objective is to predict whether the employee will leave the company or not, represented by the column **‘left’ **(1 means yes, 0 means no).
Unlike Clustering, Anomaly Detection, and NLP examples which fall under the umbrella of unsupervised Machine Learning, Classification is a **supervised **technique and hence it is implemented in two parts:
Part 1: Training a Classification Model in Power BI
The first step is to create a duplicate of the table ‘employee’ in Power Query Editor which will be used for training a model.

Run the following code in the newly created duplicate table ‘employee (model training)’ to train a classification model:
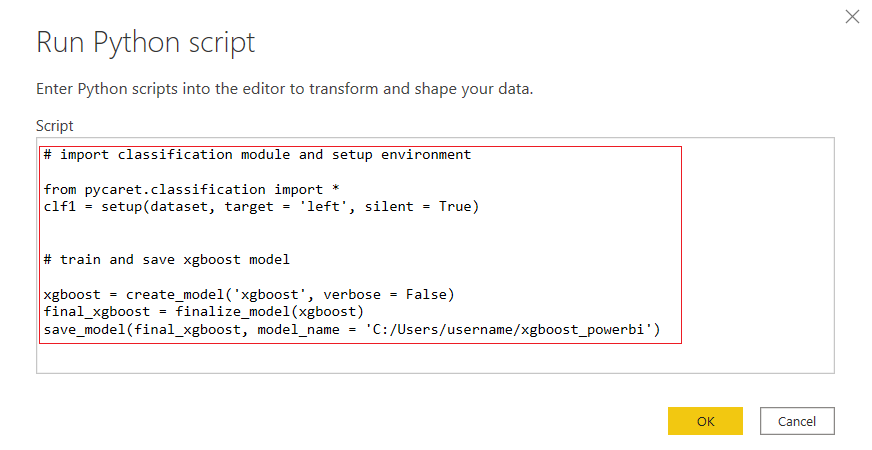
Output:
The output of this script will be a **pickle file **saved at the defined location. The pickle file contains the entire data transformation pipeline as well as trained model object.
💡 An alternate to this would be to train a model in Jupyter notebook instead of Power BI. In this case, Power BI will only be used to generate predictions on the front-end using a pre-trained model in Jupyter notebook that will be imported as a pickle file into Power BI (follow Part 2 below). To learn more about using PyCaret in Python, click here.
💡 If you want to learn how to train a classification model in Python using Jupyter Notebook, please see our Binary Classification 101 Beginner’s Tutorial. (no coding background needed).
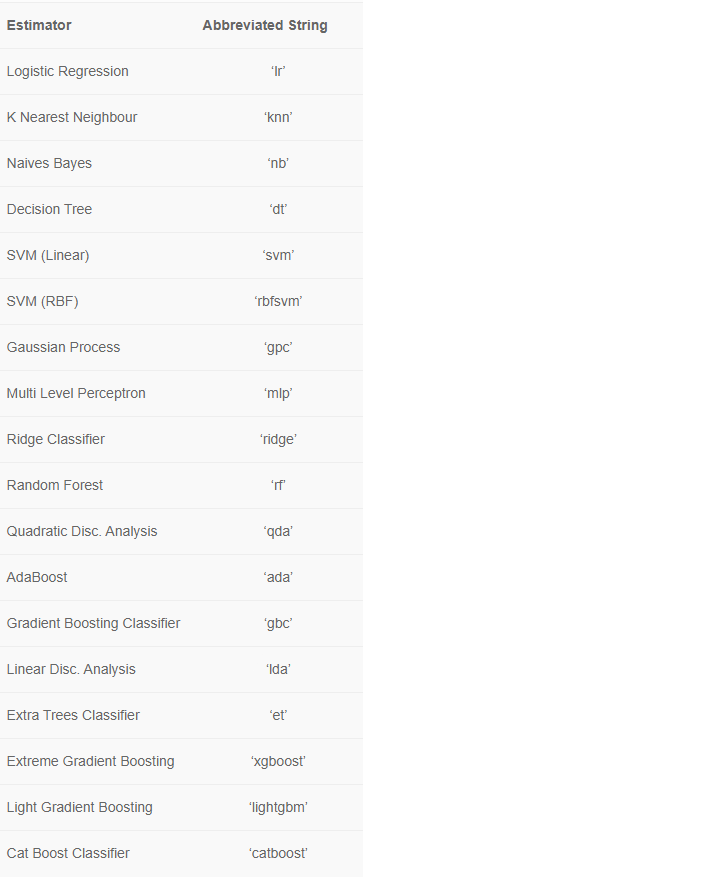
There are 18 ready-to-use classification algorithms available in PyCaret:
Part 2: Generate Predictions using Trained Model
We can now use the trained model on the original **‘employee’ **table to predict whether the employee will leave the company or not (1 or 0) and the probability %. Run the following code as python script to generate predictions:
Output:


Two new columns are attached to the original table. The ‘Label’ column indicates the prediction and ‘Score’ column is the probability of outcome.
In this example we have predicted on the same data that we have used for training the model for demonstration purpose only. In a real setting, the ‘Left’ column is the actual outcome and is unknown at the time of prediction.
In this tutorial we have trained an Extreme Gradient Boosting (‘xgboost’) model and used it to generate predictions. We have done this for simplicity only. Practically, you can use PyCaret to predict any type of model or chain of models.
PyCaret’s predict_model( ) function can work seamlessly with the pickle file created using PyCaret as it contains the entire transformation pipeline along with trained model object. Click here to learn more about the **predict_model **function.
💡 All the preprocessing tasks necessary to train a classification model such as missing value imputation (if table has any missing or *null *values), or one-hot-encoding, or target encoding, they all are automatically performed before training a model. Click here to learn more about PyCaret’s preprocessing capabilities.
📘 Example 6— Regression in Power BI
**Regression **is a supervised machine learning technique used to predict the a continuous outcome in the best possible way given the past data and its corresponding past outcomes. Unlike Classification which is used for predicting a binary outcome such as Yes or No (1 or 0), Regression is used for predicting continuous values such as Sales, Price, quantity etc.
In this tutorial we will use the ‘boston.csv’ file available on pycaret’s github repository. You can load the data using a web connector. (Power BI Desktop → Get Data → From Web).
**Link to csv file: **https://raw.githubusercontent.com/pycaret/pycaret/master/datasets/boston.csv
**Objective: **The table ‘boston’ contains information on 506 houses in Boston such as average number of rooms, property tax rates, population etc. Based on these columns (also known as features in machine learning terminology) the objective is to predict the median value of house, represented by column ‘medv’.
Part 1: Training a Regression Model in Power BI
The first step is to create a duplicate of the ‘boston’ table in Power Query Editor that will be used for training a model.
Run the following code in the new duplicate table as python script:
Output:
The output of this script will be a **pickle file **saved at the defined location. The pickle file contains the entire data transformation pipeline as well as trained model object.
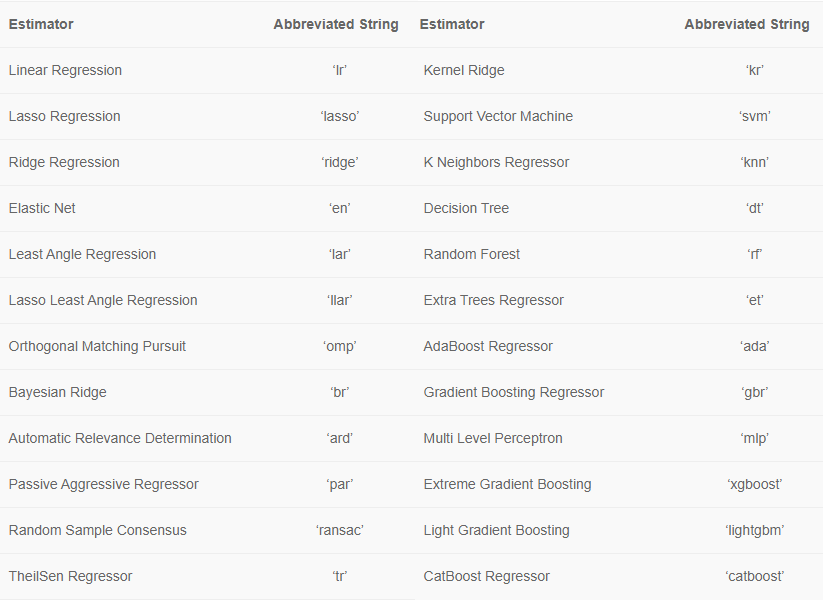
There are over 20 ready-to-use regression algorithms available in PyCaret:
Part 2: Generate Predictions using Trained Model
We can now use the trained model to predict the median value of houses. Run the following code in the original table *‘boston’ ***as a python script:
Output:


A new column ‘Label’ that contains predictions are attached to the original table.
In this example we have predicted on the same data that we have used for training the model for demonstration purpose only. In a real setting, the ‘medv’ column is the actual outcome and is unknown at the time of prediction.
💡 All the preprocessing tasks necessary to train a regression model such as missing value imputation (if table has any missing or *null *values), or one-hot-encoding, or target transformation, they all are automatically performed before training a model. Click here to learn more about PyCaret’s preprocessing capabilities.
Next Tutorial
In the next tutorial of **Machine Learning in Power BI using PyCaret **series, we will go in more depth and explore advanced preprocessing features in PyCaret. We will also see how to productionalize a machine learning solution in Power BI and leverage the power of PyCaret on the front-end of Power BI.
If you would like to learn more on this please stay connected.
Follow us on our Linkedin page and subscribe to our Youtube channel.
Also see:
Beginner level Python notebooks:
Clustering Anomaly Detection Natural Language Processing Association Rule Mining Regression Classification
What’s in the development pipeline?
We are actively working on improving PyCaret. Our future development pipeline includes a new **Time Series Forecasting **module, integration with **TensorFlow, **and major improvements on the scalability of PyCaret. If you would like to share your feedback and help us improve further, you may fill this form on the website or leave a comment on our Github or LinkedIn page.
Want to learn about a specific module?
As of the first release 1.0.0, PyCaret has the following modules available for use. Click on the links below to see the documentation and working examples in Python.
Classification Regression Clustering Anomaly Detection Natural Language Processing Association Rule Mining
Important Links
User Guide / Documentation Github Repository Install PyCaret Notebook Tutorials Contribute in PyCaret
Please give us ⭐️ on our github repo if you like PyCaret.
Follow me on Medium: https://medium.com/@moez_62905/
Last updated
Was this helpful?