Predicting Gold Prices Using Machine Learning
Predicting Gold Prices Using Machine Learning
by Mohammad Riazuddin
Part- I Importing and Preparing Data
Introduction
I have been a student of financial markets for over a decade and have been studying different asset classes and their behavior in different economic conditions. It is difficult to find an asset class which has greater polarization than Gold. There are people who love it and people who hate it, and more often than not, they remain in the same camp forever. Since Gold has very little fundamentals of its own (again a source of polarization), in this multi-part series I will try to predict Gold Price returns using several Machine Learning techniques. Listed below is how I (currently) envisage the series to be:
Part I : Defining the approach, gathering and preparing data
Part II : Regression modelling using PyCaret
Part III: Classification modelling using PyCaret
Part IV: Time Series modelling using Prophet (Facebook)
Part V : Evaluating integration of approaches
“Please note that Gold is a very widely traded asset in an extremely competitive market. Making money consistently from any strategy for a long time is extremely difficult, if not impossible. The article is only to share my experience and not a prescription or advocacy to invest or trade. However, to students of the field like myself, the idea can be extended and developed into trading algorithms with individual efforts.”
Background
Gold has been the original store of value and medium of exchange to mankind for centuries till paper currency took over a couple of centuries ago. However, most of the sustainable paper currencies were backed by Gold till as late as 1971, when the Bretton Woods agreement was scrapped and world currencies became a true ′𝐹𝑖𝑎𝑡′ currency.
Gold, however, continues to garner interest not only as a metal of choice for jewelry, but also as a store of value and often advisable part of a diversified investment portfolio as it tends to be an effective inflation hedge and safe haven when economies are going through a rough patch.
Approach
In the series we will take different approaches to predict returns from Gold prices using **Machine learning **as highlighted in introduction section
First we will go the regression route to predict future returns of Gold over next 2 and 3 week period. We will do this by using historical returns of different instruments which I believe impact the outlook towards Gold. The fundamental reason is, that I term Gold as a *‘reactionary’ *asset. It has little fundamentals of its own and movement in prices often is a derivative of how investors view other asset classes (equities, commodities etc.).
Importing Data
For this and subsequent exercises, we will need closing price of several instruments for past 10 years . There are various paid (Reuters, Bloomberg) and free resources (IEX, Quandl, Yahoofinance, Google finance) that we can use to import data. Since this project needed different type of asset classes (Equities, Commodities, Debt and precious metals) I found the ‘*yahoofinancials*’ package to be very helpful and straight forward.
I have prepared a list of instruments for which we need to import data. yahoofinancials package requires Yahoo ticker symbols. The list contains the ticker symbols and their descriptions. The excel file containing the list can be found here with the name ‘Ticker List’ . We import that file and extract the ticker symbols and the names as separate lists. (*see notebook*)
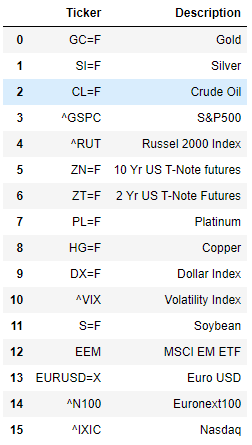
Once we have the list, we need to define what date range we need to import the data for. The period I have chosen is Jan 2010 till 1st Mar 2020. The reason I did not pull data prior to that is because the **Global Financial Crisis (GFC) **in 2008–09 massively changed the economic and market landscapes. Relationships prior to that period might be of less relevance now.
We create a date-range and write it to an empty dataframe named values where we would extract and paste data we pull from yahoofinancials.
Once we have the date range in dataframe, we need to use ticker symbols to pull out data from the API. ***yahoofinancials ***returns the output in a JSON format. The following code loops over the the list of ticker symbols and extracts just the closing prices for all the historical dates and adds them to the dataframe horizontally merging on the date. Given these asset classes might have different regional and trading holidays, the date ranges for every data pull might not be the same. By merging, we will eventually have several NAs which we will frontfill later on.

Preparing Data
In approach above, we highlighted that we will be using lagged returns of the listed instruments to predict future returns on Gold. Here we go on to calculate short-term historical returns of all the instruments and longer term historical returns of few selected instruments.
The fundamental idea behind it is, that if a certain asset has highly outperformed or under performed, there is greater likelihood of portfolio re balancing which would impact returns on other asset classes going forward. *Eg: If the stock markets (say S&P500) has shown stupendous returns in past 6 months, asset managers might want to book profits and allocate some funds to say precious metals and prepare for stock market correction. *The chart below shows how the price movement and correlation between Gold and S&P500 in different market conditions.
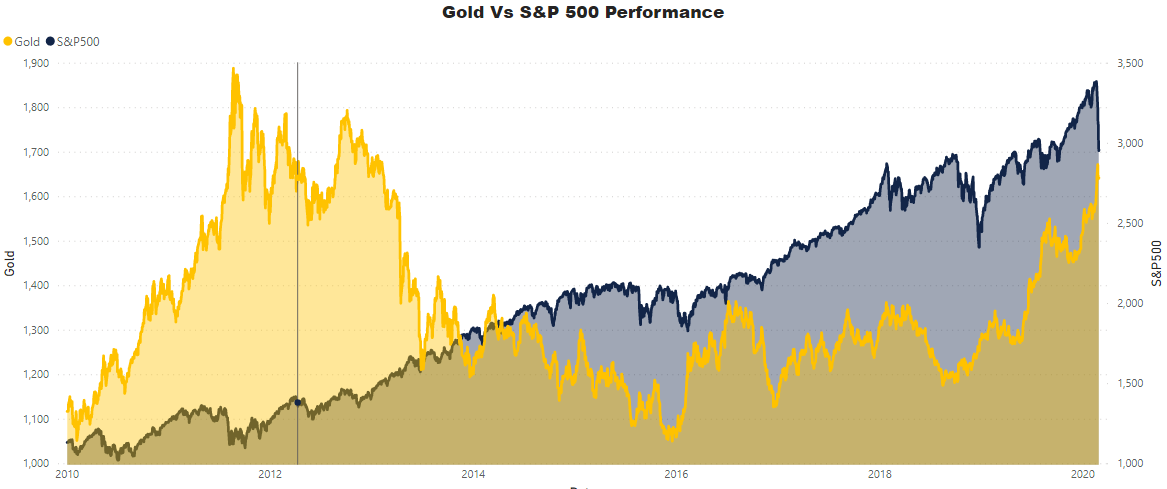
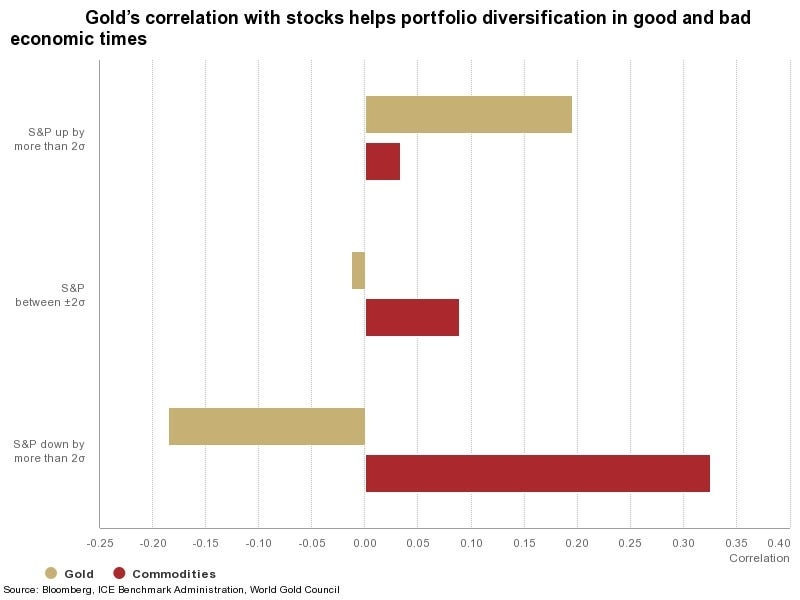
We can see above that Gold exhibits negative correlation when S&P500 has an extreme negative movement. Recent sharp fall in stock markets also highlights a similar relationship when Gold rose in anticipation of the fall recording 11% gain YTD compared to 11% YTD loss for S&P500.
We will however, use Machine Learning to evaluate the hypothesis. You can directly download the values data from my git-hub repo contained in file name ‘Training Data_Values’
Besides the lagged returns, we also see how far the current Gold price is from its moving averages for different windows. This is a very commonly used metric in technical analysis where moving averages offer supports and resistances for asset prices. We use a combination of simple and exponential moving averages. We then add these moving averages to the existing feature space.

This was all about features. Now we need to create targets, i.e what we want to predict. Since we are predicting returns, we need to pick a horizon for which we need to predict returns. I have chosen 14-day and 22-day horizons because other smaller horizons tend to be very volatile and lack predictive power. One can however, experiment with other horizons as well.
Now we have the complete data set ready to start modelling. In the next part we will experiment with different algorithms using the extremely innovative and efficient PyCaret library. I will also exhibit how a pipeline can be created to continuously import new data to generate predictions using the trained models.
Predicting Gold Prices Using Machine Learning
Part- II Regression Modelling with PyCaret
In Part-I, we discussed importing data from open source free API and prepared it in a manner which is suitable for our intended Machine Learning exercise. You can refer to Part-I for the codes or import the final dataset in file name ‘Training Data’ from the github repo.
PyCaret is an open source machine learning library in Python which can be used across any notebook environment and drastically reduces the coding effort making the process extremely efficient and productive. In section below we will see how*** PyCaret ***can supercharge any machine learning experiment. To begin, you will need to install PyCaret using :
22-Day Model
We take up 22-Day horizon as the target. This means, given the historical data, we will try to predict return in Gold over the next three weeks.
Setup
To begin any modelling exercise in PyCaret, the first step is the ‘setup’ function. The mandatory variables here are the dataset and the target label in the dataset. All the elementary and necessary data transformations like dropping IDs, One-Hot Encoding the categorical factors and missing value imputation happens behind the scene automatically. PyCaret also offers over 20 pre-processing options. For this example we would go with basics in setup and would try different pre-processing techniques in later experiments.
In the code above, dataset passed as ‘data_22’ and target is pointed to the column labeled ‘Gold-T+22’. I have specifically mentioned ‘Date’ column to be ignored so as to prevent PyCaret to create time based features on the date column, which might be very helpful in other cases, but we are not evaluating that now. If you want to see the distribution and correlation between variables, you can keep the argument ‘profile=True’, which displays a panda profiler output. I have intentionally provided ‘session_id=11’ to be able to recreate the results.
The Magic Command....compare_models( )
In the next step I will employ one of my favorite feature of PyCaret, which cuts down hundreds of lines of codes to basically 2 words — ‘compare_models’. The function uses all the algorithms (25 as now) and fits them to the data, runs a 10-fold cross-validation and spits out 6 evaluation metrics for each model. All this with just 2-words. Two additional arguments that can be used in the function in the interest of time are:
a. turbo=False — True in default. When turbo=True, compare models does not evaluate few of the more costly algorithms, namely Kernel Ridge (kr), Automatic Relevance Determination (ard) and Multi-level Perceptron (mlp)
b. blacklist — Here, one can pass list of algorithm abbreviations (see docstring) which are known to take much longer time and with little performance improvement. Eg: Below I have blacklisted Theilsen Regressor (tr)
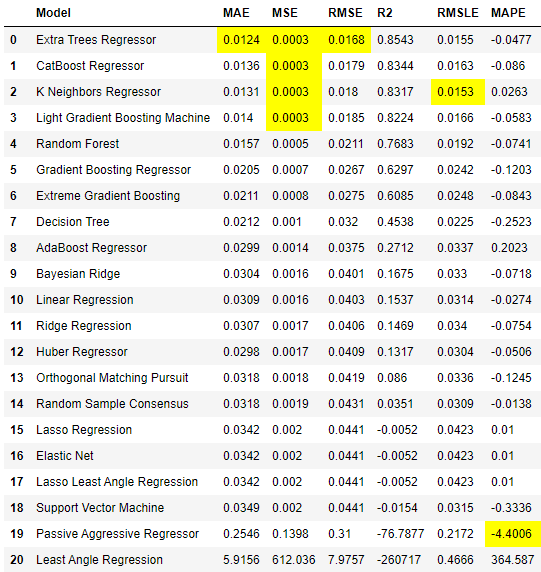
We will use R-Square (R2) as the metric of choice here. We see that ET, Catboost and KNN are the top three models. In the next step we would tune the hyper-parameters of the three models.
Tuning Model Hyper-parameters
PyCaret has a pre-defined grid for every algorithm and tune_model() function uses a randomized grid search to find the set of parameters that optimize the choice of metrics (Rsquare here) and displays the cross-validated score for the optimized model. It does not accept a trained model, and needs abbreviation of an estimator passed as string. We will tune Extra Tree (et), K Nearest Neighbors(knn) and CatBoost (catboost) regressors .
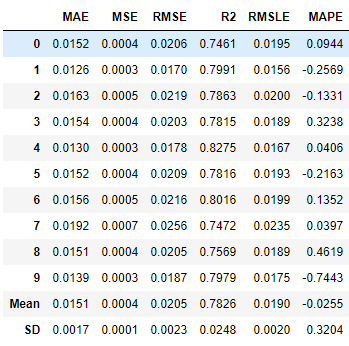
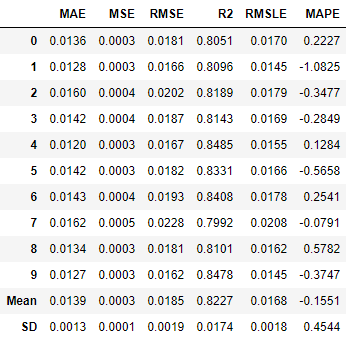
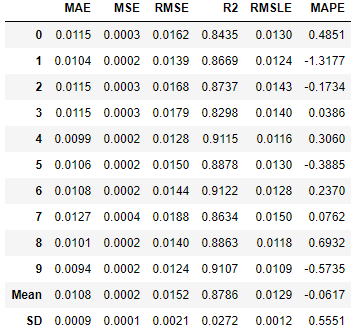
We can see above that knn’s R2 increased significantly to 87.86% after tuning, much higher than et and catboost, which did not improve after tuning. This can be because of randomization in the grid search process. At some very high number of iterations, they might improve.
I would also create a base Extra Tree (et) model since its original performance (before tuning ) was very close to tuned knn. We will use the create_model() function in PyCaret to create the model.
Evaluate Model
It is important to conduct some model diagnostics on trained models. We will use the ***evaluate_model() ***function in PyCaret to see collection of plots and other diagnostics. It takes in a trained model to return selection of model diagnostic plots and model definitions. We would do do model diagnostics on both of our top models i.e knn_tuned and et.
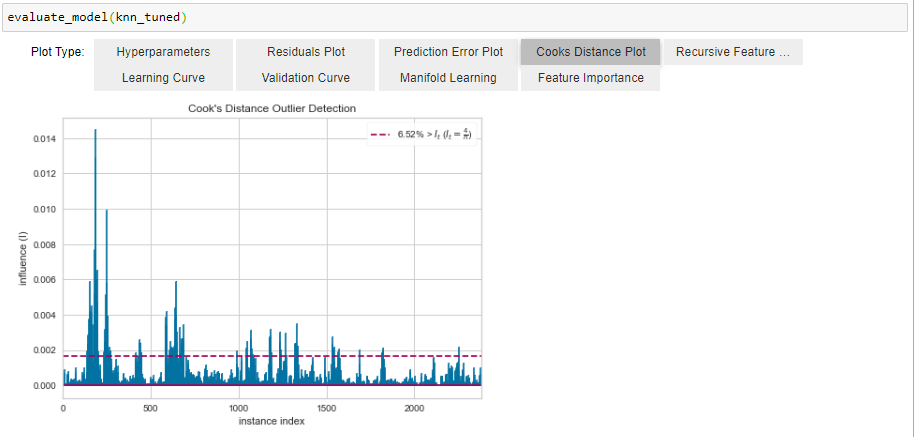
Above, we can see that clearly within the first 500 observations, there were many outliers which not only impact the model performance, but might also impact model generalization in future. Hence, it might be worthy to remove these outliers. But before we do that we will see the feature importance through et (knn does no offer feature importance)
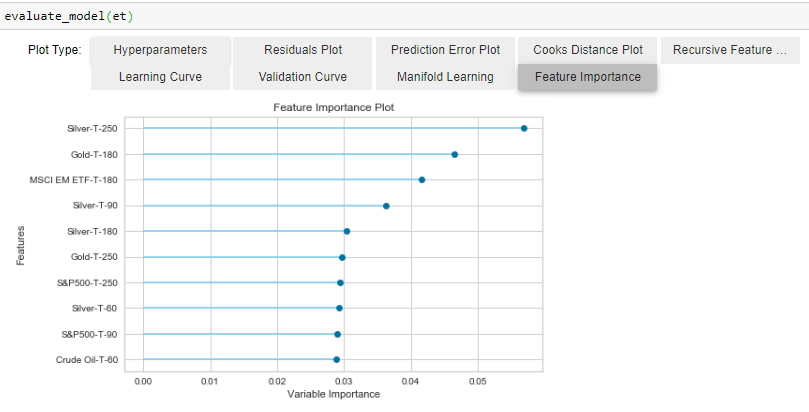
We see that return on Silver and EM ETF have on of the highest feature importance, underlining the fact that Silver and Gold often move in pairs while portfolio allocation does shift between Emerging Market equity and Gold.
Removing Outliers
To remove outliers, we need to go back to the setup stage and use PyCaret’s inbuilt outlier remover and create the models again to see the impact.
If the ***‘remove_outliers’ ***argument is set to true, PyCaret removes outliers identified through PCA linear dimensionality reduction using the Singular Value Decomposition (SVD) technique. The default impurity level is 5%. This means it will remove 5% of the observation which it feels are outliers.
After removing the outliers, we run our top models again to see if there is any performance improvement, and there clearly is.
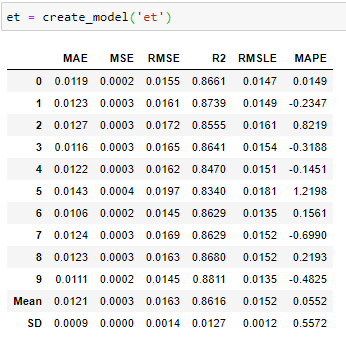
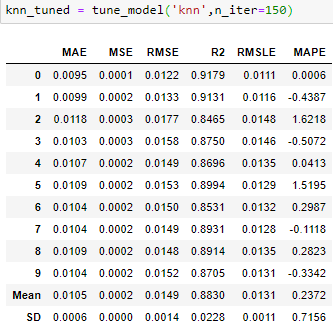
We see that performance of et has improved from 85.43% to 86.16% and that of knn_tuned has improved from 87.86% to 88.3%. There has also been reduction in SD across folds.
Ensemble Models
We can also try to see if bagging/boosting can improve the model performance. We can use the ***ensemble_model() ***function in PyCaret to quickly see how ensembling methods can improve results through following codes:
The above codes will show a similar cross validated score, which did not show much improvement. The results can be seen in the notebook link in the repo.
Blending Models
We can blend the top 2 models (et and knn_tuned) to see if blended models can perform better. It is often seen that blended models often learn different patterns and together they have better predictive powers. I will use the ***blend_models() ***function of PyCaret for this. It takes a list of trained models and returns a blended model and 10-fold cross validated scores.
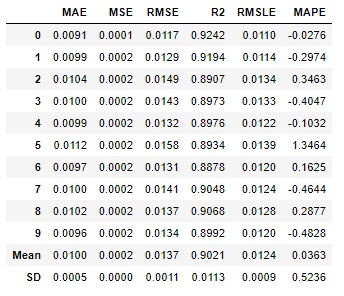
In the table above we see that blend of ***knn_tuned ***and et returns Mean R2 better than both. It is 1.9% increase in mean R2 and reduction in SD of R2 over ***knn_tuned ***implying a better and more consistent performance across folds.
The mean R2 of 90.2% imply that our model is able to capture on an average 90.2% of the variation in Gold returns from the features we have provided.
Stacking Models
Though the results from blending models is great, I like to see if there is a possibility of extracting few more basis points of R2 from the data. To do that we would build a multi level stack of models. This is different from blending as in layers of models are stacked in sequence such that predictions of from models in one layer are passed to the next layer of model along with the original features (if restack = True). The predictions from one set of models help subsequent models immensely in predicting. At the end of the chain is the meta-model (linear by default). PyCaret guide has more details on the topic. In the notebook I have tried several architectures. Presenting below is the one with best performance:
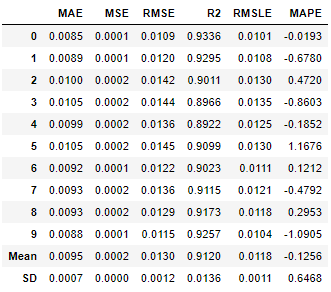
As we can see above, stack2 model has 1% better R2 than blend_knn_et, we would chose stack2 as the best model and save it for prediction.
Saving Model
Once the model is trained, we need to save the model in order to use it on new data to make the prediction. We can achieve this by save_model(). This saves the model in the current directory or any defined path. The code below would save the model and pre-processing pipeline with the name ‘22Day Regressor’
Making Prediction on New Data
Once we have saved our model, we would want to make prediction on new data as they arrive. We can rely on the yahoofinancials package to give us the closing prices of all the instruments, however, we need to prepare the new data again to be able to use the model. The steps will be similar to the what we did while preparing the training data, only difference is we will import the latest data and we will not be creating labels (we cant as we do not have future prices). The following code chuck should import and shape the data making it ready for prediction.
Once data is prepared, we need to load the model and make prediction. To load the model, we will again use the PyCaret’s regression module. The codes below would load the model, make prediction on the new data, and give use the historic prices, Projected Return and the forecasted prices in 3 weeks for each date in the dataset.
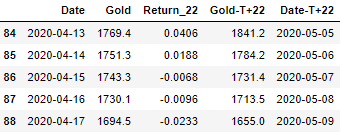
The table output above shows that closing price of Gold on 17th April 2020 was $1,694.5 and the model predicts that in next 22-Days the returns would be -2.3% resulting in a price target of $1,655 by 9th of May 2020. I have created a separate notebook for prediction titled “Gold Prediction New Data — Regression” which can be found in the repo here.
We can use the same concepts and techniques for T+14 day prediction. The codes and output can be found in the Jupyter notebook titles “Gold Prediction Experiment Regression — PyCaret” in the repo here.
Important Links
Link to Part-III — Predicting Crashes in Gold Prices
Link to the Github Repository
Follow me on LinkedIn
Guide to PyCaret
Last updated
Was this helpful?